Ethiopian vs Immigrants from Senegal Poverty
COMPARE
Ethiopian
Immigrants from Senegal
Poverty
Poverty Comparison
Ethiopians
Immigrants from Senegal
12.2%
POVERTY
59.1/ 100
METRIC RATING
162nd/ 347
METRIC RANK
15.3%
POVERTY
0.0/ 100
METRIC RATING
298th/ 347
METRIC RANK
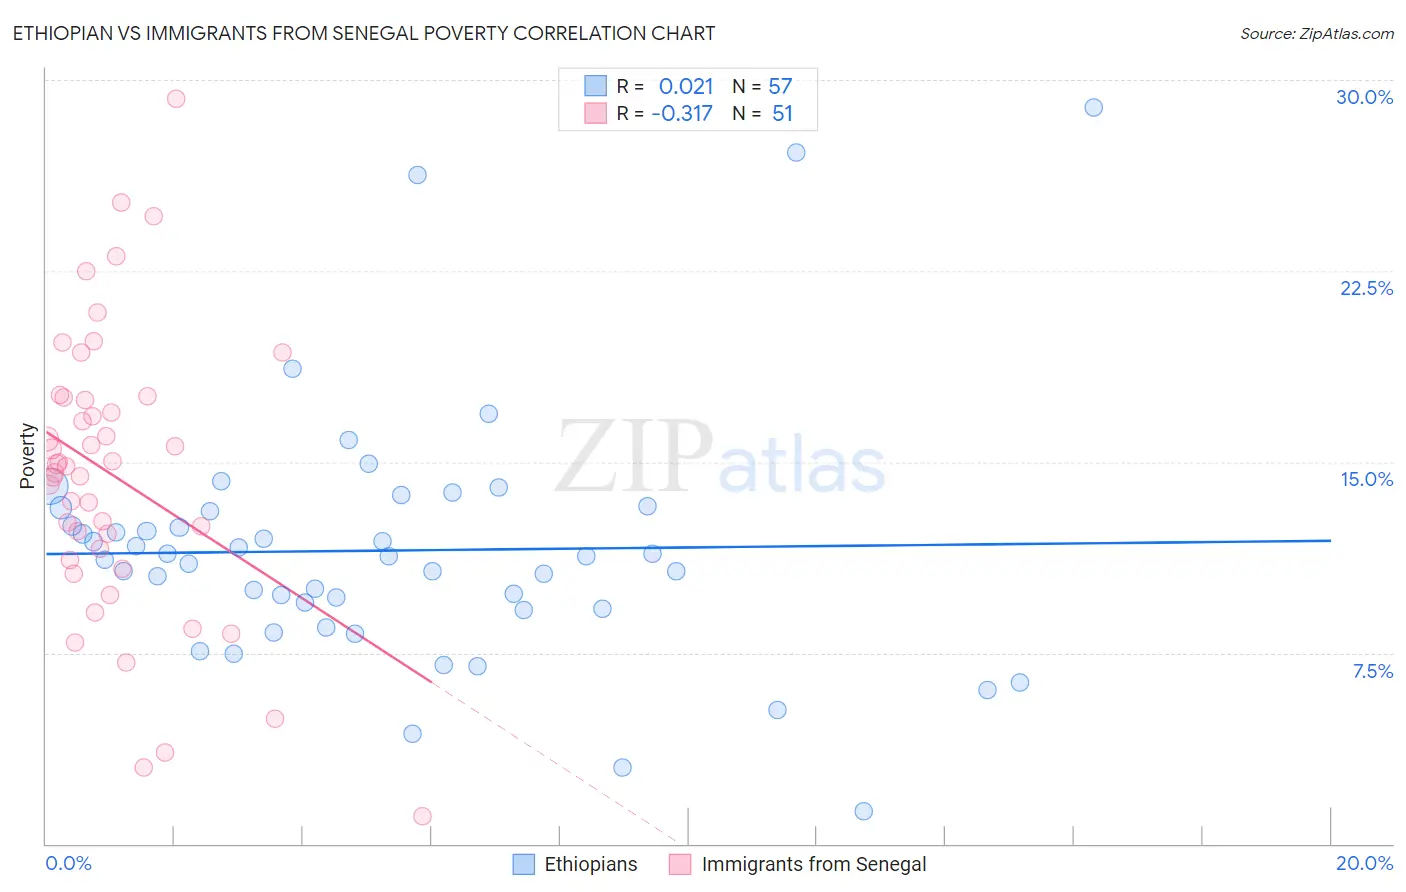
Ethiopian vs Immigrants from Senegal Poverty Correlation Chart
The statistical analysis conducted on geographies consisting of 223,124,419 people shows no correlation between the proportion of Ethiopians and poverty level in the United States with a correlation coefficient (R) of 0.021 and weighted average of 12.2%. Similarly, the statistical analysis conducted on geographies consisting of 90,124,695 people shows a mild negative correlation between the proportion of Immigrants from Senegal and poverty level in the United States with a correlation coefficient (R) of -0.317 and weighted average of 15.3%, a difference of 25.2%.
Poverty Correlation Summary
| Measurement | Ethiopian | Immigrants from Senegal |
| Minimum | 1.3% | 1.1% |
| Maximum | 28.9% | 29.3% |
| Range | 27.7% | 28.2% |
| Mean | 11.5% | 14.4% |
| Median | 11.3% | 14.8% |
| Interquartile 25% (IQ1) | 9.2% | 11.1% |
| Interquartile 75% (IQ3) | 13.1% | 17.5% |
| Interquartile Range (IQR) | 3.9% | 6.4% |
| Standard Deviation (Sample) | 5.0% | 5.6% |
| Standard Deviation (Population) | 4.9% | 5.6% |
Similar Demographics by Poverty
Demographics Similar to Ethiopians by Poverty
In terms of poverty, the demographic groups most similar to Ethiopians are Immigrants from Fiji (12.2%, a difference of 0.010%), Immigrants from Ethiopia (12.2%, a difference of 0.050%), Colombian (12.2%, a difference of 0.12%), Immigrants from Nepal (12.2%, a difference of 0.13%), and Immigrants from Albania (12.2%, a difference of 0.13%).
| Demographics | Rating | Rank | Poverty |
| Hungarians | 63.6 /100 | #155 | Good 12.2% |
| Scotch-Irish | 62.6 /100 | #156 | Good 12.2% |
| Costa Ricans | 62.2 /100 | #157 | Good 12.2% |
| Taiwanese | 61.8 /100 | #158 | Good 12.2% |
| Pennsylvania Germans | 60.8 /100 | #159 | Good 12.2% |
| Immigrants | Nepal | 60.4 /100 | #160 | Good 12.2% |
| Immigrants | Fiji | 59.1 /100 | #161 | Average 12.2% |
| Ethiopians | 59.1 /100 | #162 | Average 12.2% |
| Immigrants | Ethiopia | 58.6 /100 | #163 | Average 12.2% |
| Colombians | 57.8 /100 | #164 | Average 12.2% |
| Immigrants | Albania | 57.7 /100 | #165 | Average 12.2% |
| Venezuelans | 56.9 /100 | #166 | Average 12.2% |
| Immigrants | Chile | 56.7 /100 | #167 | Average 12.2% |
| Immigrants | Venezuela | 56.5 /100 | #168 | Average 12.2% |
| Whites/Caucasians | 55.4 /100 | #169 | Average 12.3% |
Demographics Similar to Immigrants from Senegal by Poverty
In terms of poverty, the demographic groups most similar to Immigrants from Senegal are Senegalese (15.3%, a difference of 0.090%), Immigrants from Bangladesh (15.3%, a difference of 0.15%), Hispanic or Latino (15.3%, a difference of 0.19%), Guatemalan (15.3%, a difference of 0.20%), and Immigrants from Central America (15.4%, a difference of 0.47%).
| Demographics | Rating | Rank | Poverty |
| Immigrants | Cabo Verde | 0.0 /100 | #291 | Tragic 15.1% |
| Indonesians | 0.0 /100 | #292 | Tragic 15.1% |
| Immigrants | Zaire | 0.0 /100 | #293 | Tragic 15.1% |
| Blackfeet | 0.0 /100 | #294 | Tragic 15.2% |
| Guatemalans | 0.0 /100 | #295 | Tragic 15.3% |
| Hispanics or Latinos | 0.0 /100 | #296 | Tragic 15.3% |
| Immigrants | Bangladesh | 0.0 /100 | #297 | Tragic 15.3% |
| Immigrants | Senegal | 0.0 /100 | #298 | Tragic 15.3% |
| Senegalese | 0.0 /100 | #299 | Tragic 15.3% |
| Immigrants | Central America | 0.0 /100 | #300 | Tragic 15.4% |
| Bahamians | 0.0 /100 | #301 | Tragic 15.4% |
| Somalis | 0.0 /100 | #302 | Tragic 15.4% |
| Immigrants | Caribbean | 0.0 /100 | #303 | Tragic 15.5% |
| Immigrants | Mexico | 0.0 /100 | #304 | Tragic 15.5% |
| Immigrants | Guatemala | 0.0 /100 | #305 | Tragic 15.5% |