Immigrants from South Africa vs Yuman Poverty
COMPARE
Immigrants from South Africa
Yuman
Poverty
Poverty Comparison
Immigrants from South Africa
Yuman
11.5%
POVERTY
94.7/ 100
METRIC RATING
96th/ 347
METRIC RANK
20.2%
POVERTY
0.0/ 100
METRIC RATING
338th/ 347
METRIC RANK
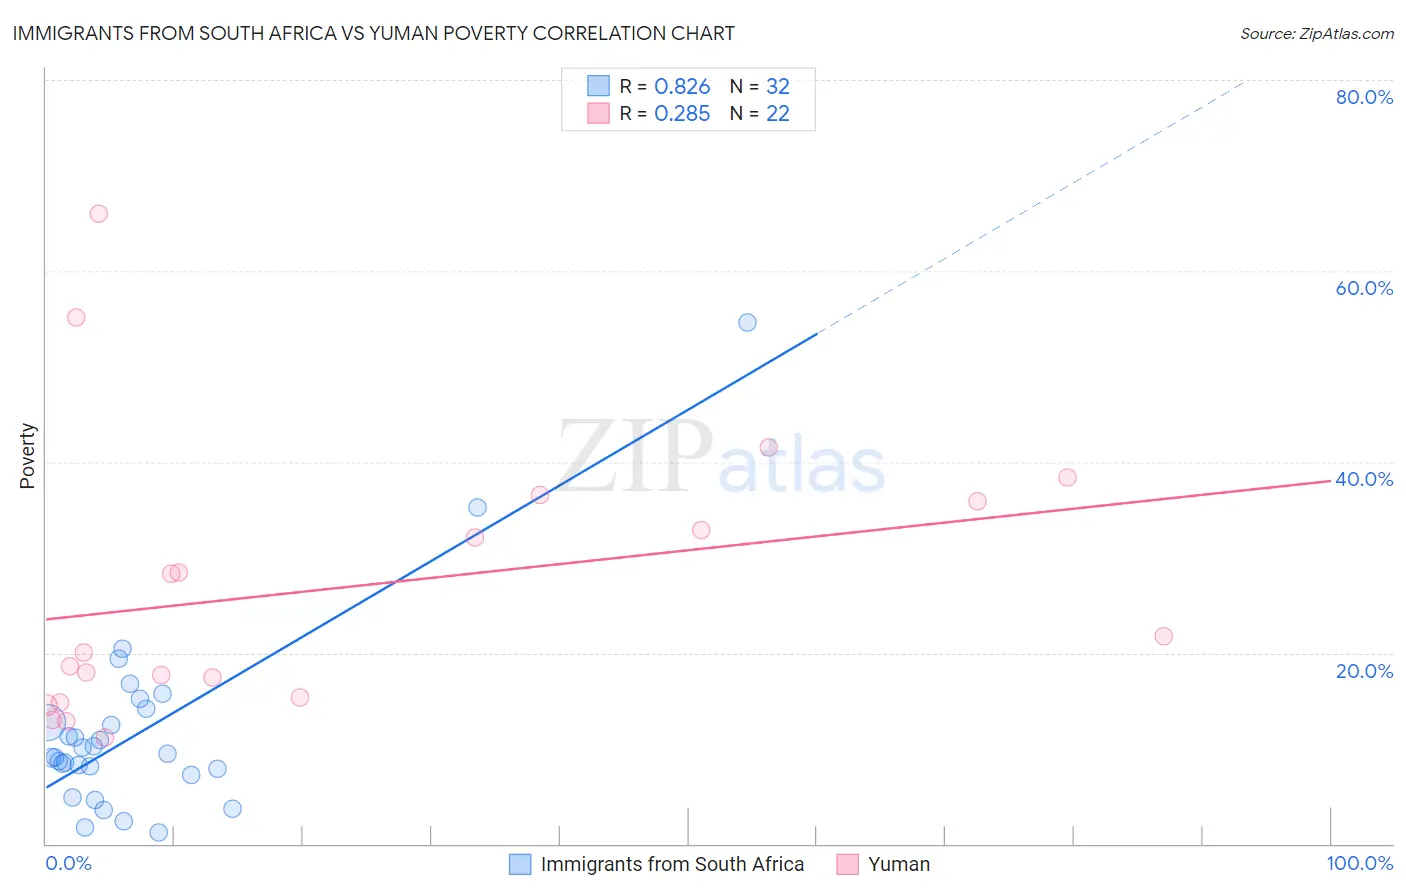
Immigrants from South Africa vs Yuman Poverty Correlation Chart
The statistical analysis conducted on geographies consisting of 233,262,094 people shows a very strong positive correlation between the proportion of Immigrants from South Africa and poverty level in the United States with a correlation coefficient (R) of 0.826 and weighted average of 11.5%. Similarly, the statistical analysis conducted on geographies consisting of 40,667,603 people shows a weak positive correlation between the proportion of Yuman and poverty level in the United States with a correlation coefficient (R) of 0.285 and weighted average of 20.2%, a difference of 76.3%.
Poverty Correlation Summary
| Measurement | Immigrants from South Africa | Yuman |
| Minimum | 1.2% | 11.1% |
| Maximum | 54.5% | 66.0% |
| Range | 53.4% | 54.9% |
| Mean | 11.8% | 26.8% |
| Median | 9.3% | 20.9% |
| Interquartile 25% (IQ1) | 7.5% | 15.3% |
| Interquartile 75% (IQ3) | 13.4% | 35.8% |
| Interquartile Range (IQR) | 5.9% | 20.5% |
| Standard Deviation (Sample) | 10.2% | 14.4% |
| Standard Deviation (Population) | 10.0% | 14.1% |
Similar Demographics by Poverty
Demographics Similar to Immigrants from South Africa by Poverty
In terms of poverty, the demographic groups most similar to Immigrants from South Africa are Immigrants from Egypt (11.5%, a difference of 0.030%), Immigrants from Latvia (11.5%, a difference of 0.070%), Paraguayan (11.4%, a difference of 0.12%), Australian (11.4%, a difference of 0.12%), and Romanian (11.4%, a difference of 0.14%).
| Demographics | Rating | Rank | Poverty |
| Czechoslovakians | 95.7 /100 | #89 | Exceptional 11.4% |
| Immigrants | Denmark | 95.5 /100 | #90 | Exceptional 11.4% |
| Finns | 95.2 /100 | #91 | Exceptional 11.4% |
| British | 95.0 /100 | #92 | Exceptional 11.4% |
| Romanians | 94.9 /100 | #93 | Exceptional 11.4% |
| Paraguayans | 94.9 /100 | #94 | Exceptional 11.4% |
| Australians | 94.9 /100 | #95 | Exceptional 11.4% |
| Immigrants | South Africa | 94.7 /100 | #96 | Exceptional 11.5% |
| Immigrants | Egypt | 94.6 /100 | #97 | Exceptional 11.5% |
| Immigrants | Latvia | 94.5 /100 | #98 | Exceptional 11.5% |
| Immigrants | Indonesia | 94.2 /100 | #99 | Exceptional 11.5% |
| Scottish | 94.0 /100 | #100 | Exceptional 11.5% |
| Slavs | 93.3 /100 | #101 | Exceptional 11.5% |
| Laotians | 92.4 /100 | #102 | Exceptional 11.6% |
| Okinawans | 92.4 /100 | #103 | Exceptional 11.6% |
Demographics Similar to Yuman by Poverty
In terms of poverty, the demographic groups most similar to Yuman are Sioux (19.8%, a difference of 2.2%), Crow (20.7%, a difference of 2.2%), Yup'ik (20.8%, a difference of 3.0%), Hopi (20.8%, a difference of 3.2%), and Pueblo (19.4%, a difference of 4.1%).
| Demographics | Rating | Rank | Poverty |
| Immigrants | Dominican Republic | 0.0 /100 | #331 | Tragic 17.8% |
| Natives/Alaskans | 0.0 /100 | #332 | Tragic 18.1% |
| Houma | 0.0 /100 | #333 | Tragic 18.4% |
| Apache | 0.0 /100 | #334 | Tragic 18.4% |
| Cheyenne | 0.0 /100 | #335 | Tragic 18.9% |
| Pueblo | 0.0 /100 | #336 | Tragic 19.4% |
| Sioux | 0.0 /100 | #337 | Tragic 19.8% |
| Yuman | 0.0 /100 | #338 | Tragic 20.2% |
| Crow | 0.0 /100 | #339 | Tragic 20.7% |
| Yup'ik | 0.0 /100 | #340 | Tragic 20.8% |
| Hopi | 0.0 /100 | #341 | Tragic 20.8% |
| Immigrants | Yemen | 0.0 /100 | #342 | Tragic 21.5% |
| Pima | 0.0 /100 | #343 | Tragic 21.9% |
| Lumbee | 0.0 /100 | #344 | Tragic 21.9% |
| Navajo | 0.0 /100 | #345 | Tragic 23.1% |