Ethiopian vs Immigrants from Hungary Poverty

COMPARE

Ethiopian
Race
Ancestry
AfghanAfricanAlaska NativeAlaskan AthabascanAlbanianAleutAlsatianAmericanApacheArabArapahoArgentineanArmenianAssyrian/Chaldean/SyriacAustralianAustrianBahamianBangladeshiBarbadianBasqueBelgianBelizeanBermudanBhutaneseBlackfeetBolivianBrazilianBritishBritish West IndianBulgarianBurmeseCajunCambodianCanadianCape VerdeanCarpatho RusynCelticCentral AmericanCentral American IndianCherokeeCheyenneChickasawChileanChineseChippewaChoctawColombianColvilleComancheCosta RicanCreeCreekCroatianCrowCubanCypriotCzechCzechoslovakianDanishDelawareDominicanDutchDutch West IndianEastern EuropeanEcuadorianEgyptianEnglishEstonianEthiopianEuropeanFijianFilipinoFinnishFrenchFrench American IndianFrench CanadianGermanGerman RussianGhanaianGreekGuamanian/ChamorroGuatemalanGuyaneseHaitianHmongHonduranHopiHoumaHungarianIcelanderIndian (Asian)IndonesianInupiatIranianIraqiIrishIroquoisIsraeliItalianJamaicanJapaneseJordanianKenyanKiowaKoreanLaotianLatvianLebaneseLiberianLithuanianLumbeeLuxembourgerMacedonianMalaysianMalteseMarshalleseMenomineeMexicanMexican American IndianMongolianMoroccanNative HawaiianNavajoNepaleseNew ZealanderNicaraguanNigerianNorthern EuropeanNorwegianOkinawanOsageOttawaPaiutePakistaniPalestinianPanamanianParaguayanPennsylvania GermanPeruvianPimaPolishPortuguesePotawatomiPuebloPuerto RicanPuget Sound SalishRomanianRussianSalvadoranSamoanScandinavianScotch-IrishScottishSeminoleSenegaleseSerbianShoshoneSierra LeoneanSiouxSlavicSlovakSloveneSomaliSouth AfricanSouth AmericanSouth American IndianSoviet UnionSpaniardSpanishSpanish AmericanSpanish American IndianSri LankanSubsaharan AfricanSudaneseSwedishSwissSyrianTaiwaneseThaiTlingit-HaidaTohono O'OdhamTonganTrinidadian and TobagonianTsimshianTurkishU.S. Virgin IslanderUgandanUkrainianUruguayanUteVenezuelanVietnameseWelshWest IndianYakamaYaquiYugoslavianYumanYup'ikZimbabwean
Immigration
NonimmigrantsImmigrantsAfghanistanAfricaAlbaniaArgentinaArmeniaAsiaAustraliaAustriaBahamasBangladeshBarbadosBelarusBelgiumBelizeBoliviaBosnia and HerzegovinaBrazilBulgariaBurma/MyanmarCabo VerdeCambodiaCameroonCanadaCaribbeanCentral AmericaChileChinaColombiaCongoCosta RicaCroatiaCubaCzechoslovakiaDenmarkDominicaDominican RepublicEastern AfricaEastern AsiaEastern EuropeEcuadorEgyptEl SalvadorEnglandEritreaEthiopiaEuropeFijiFranceGermanyGhanaGreeceGrenadaGuatemalaGuyanaHaitiHondurasHong KongIndiaIndonesiaIranIraqIrelandIsraelItalyJamaicaJapanJordanKazakhstanKenyaKoreaKuwaitLaosLatin AmericaLatviaLebanonLiberiaLithuaniaMalaysiaMexicoMicronesiaMiddle AfricaMoldovaMoroccoNepalNetherlandsNicaraguaNigeriaNorth AmericaNorth MacedoniaNorthern AfricaNorthern EuropeNorwayOceaniaPakistanPanamaPeruPhilippinesPolandPortugalRomaniaRussiaSaudi ArabiaScotlandSenegalSerbiaSierra LeoneSingaporeSomaliaSouth AfricaSouth AmericaSouth Central AsiaSouth Eastern AsiaSouthern EuropeSpainSri LankaSt. Vincent and the GrenadinesSudanSwedenSwitzerlandSyriaTaiwanThailandTrinidad and TobagoTurkeyUgandaUkraineUruguayUzbekistanVenezuelaVietnamWest IndiesWestern AfricaWestern AsiaWestern EuropeYemenZaireZimbabweAzores
Immigrants from Hungary
Race
Ancestry
AfghanAfricanAlaska NativeAlaskan AthabascanAlbanianAleutAlsatianAmericanApacheArabArapahoArgentineanArmenianAssyrian/Chaldean/SyriacAustralianAustrianBahamianBangladeshiBarbadianBasqueBelgianBelizeanBermudanBhutaneseBlackfeetBolivianBrazilianBritishBritish West IndianBulgarianBurmeseCajunCambodianCanadianCape VerdeanCarpatho RusynCelticCentral AmericanCentral American IndianCherokeeCheyenneChickasawChileanChineseChippewaChoctawColombianColvilleComancheCosta RicanCreeCreekCroatianCrowCubanCypriotCzechCzechoslovakianDanishDelawareDominicanDutchDutch West IndianEastern EuropeanEcuadorianEgyptianEnglishEstonianEuropeanFijianFilipinoFinnishFrenchFrench American IndianFrench CanadianGermanGerman RussianGhanaianGreekGuamanian/ChamorroGuatemalanGuyaneseHaitianHmongHonduranHopiHoumaHungarianIcelanderIndian (Asian)IndonesianInupiatIranianIraqiIrishIroquoisIsraeliItalianJamaicanJapaneseJordanianKenyanKiowaKoreanLaotianLatvianLebaneseLiberianLithuanianLumbeeLuxembourgerMacedonianMalaysianMalteseMarshalleseMenomineeMexicanMexican American IndianMongolianMoroccanNative HawaiianNavajoNepaleseNew ZealanderNicaraguanNigerianNorthern EuropeanNorwegianOkinawanOsageOttawaPaiutePakistaniPalestinianPanamanianParaguayanPennsylvania GermanPeruvianPimaPolishPortuguesePotawatomiPuebloPuerto RicanPuget Sound SalishRomanianRussianSalvadoranSamoanScandinavianScotch-IrishScottishSeminoleSenegaleseSerbianShoshoneSierra LeoneanSiouxSlavicSlovakSloveneSomaliSouth AfricanSouth AmericanSouth American IndianSoviet UnionSpaniardSpanishSpanish AmericanSpanish American IndianSri LankanSubsaharan AfricanSudaneseSwedishSwissSyrianTaiwaneseThaiTlingit-HaidaTohono O'OdhamTonganTrinidadian and TobagonianTsimshianTurkishU.S. Virgin IslanderUgandanUkrainianUruguayanUteVenezuelanVietnameseWelshWest IndianYakamaYaquiYugoslavianYumanYup'ikZimbabwean
Immigration
NonimmigrantsImmigrantsAfghanistanAfricaAlbaniaArgentinaArmeniaAsiaAustraliaAustriaBahamasBangladeshBarbadosBelarusBelgiumBelizeBoliviaBosnia and HerzegovinaBrazilBulgariaBurma/MyanmarCabo VerdeCambodiaCameroonCanadaCaribbeanCentral AmericaChileChinaColombiaCongoCosta RicaCroatiaCubaCzechoslovakiaDenmarkDominicaDominican RepublicEastern AfricaEastern AsiaEastern EuropeEcuadorEgyptEl SalvadorEnglandEritreaEthiopiaEuropeFijiFranceGermanyGhanaGreeceGrenadaGuatemalaGuyanaHaitiHondurasHong KongHungaryIndiaIndonesiaIranIraqIrelandIsraelItalyJamaicaJapanJordanKazakhstanKenyaKoreaKuwaitLaosLatin AmericaLatviaLebanonLiberiaLithuaniaMalaysiaMexicoMicronesiaMiddle AfricaMoldovaMoroccoNepalNetherlandsNicaraguaNigeriaNorth AmericaNorth MacedoniaNorthern AfricaNorthern EuropeNorwayOceaniaPakistanPanamaPeruPhilippinesPolandPortugalRomaniaRussiaSaudi ArabiaScotlandSenegalSerbiaSierra LeoneSingaporeSomaliaSouth AfricaSouth AmericaSouth Central AsiaSouth Eastern AsiaSouthern EuropeSpainSri LankaSt. Vincent and the GrenadinesSudanSwedenSwitzerlandSyriaTaiwanThailandTrinidad and TobagoTurkeyUgandaUkraineUruguayUzbekistanVenezuelaVietnamWest IndiesWestern AfricaWestern AsiaWestern EuropeYemenZaireZimbabweAzores
Poverty
Income
Poverty
Unemployment
Labor Participation
Family Structure
Vehicle Availability
Education Level
Disability

Poverty Comparison

Ethiopians

Immigrants from Hungary

Average
Excellent
12.2%
POVERTY
59.1/ 100
METRIC RATING
162nd/ 347
METRIC RANK
11.7%
POVERTY
88.6/ 100
METRIC RATING
123rd/ 347
METRIC RANK

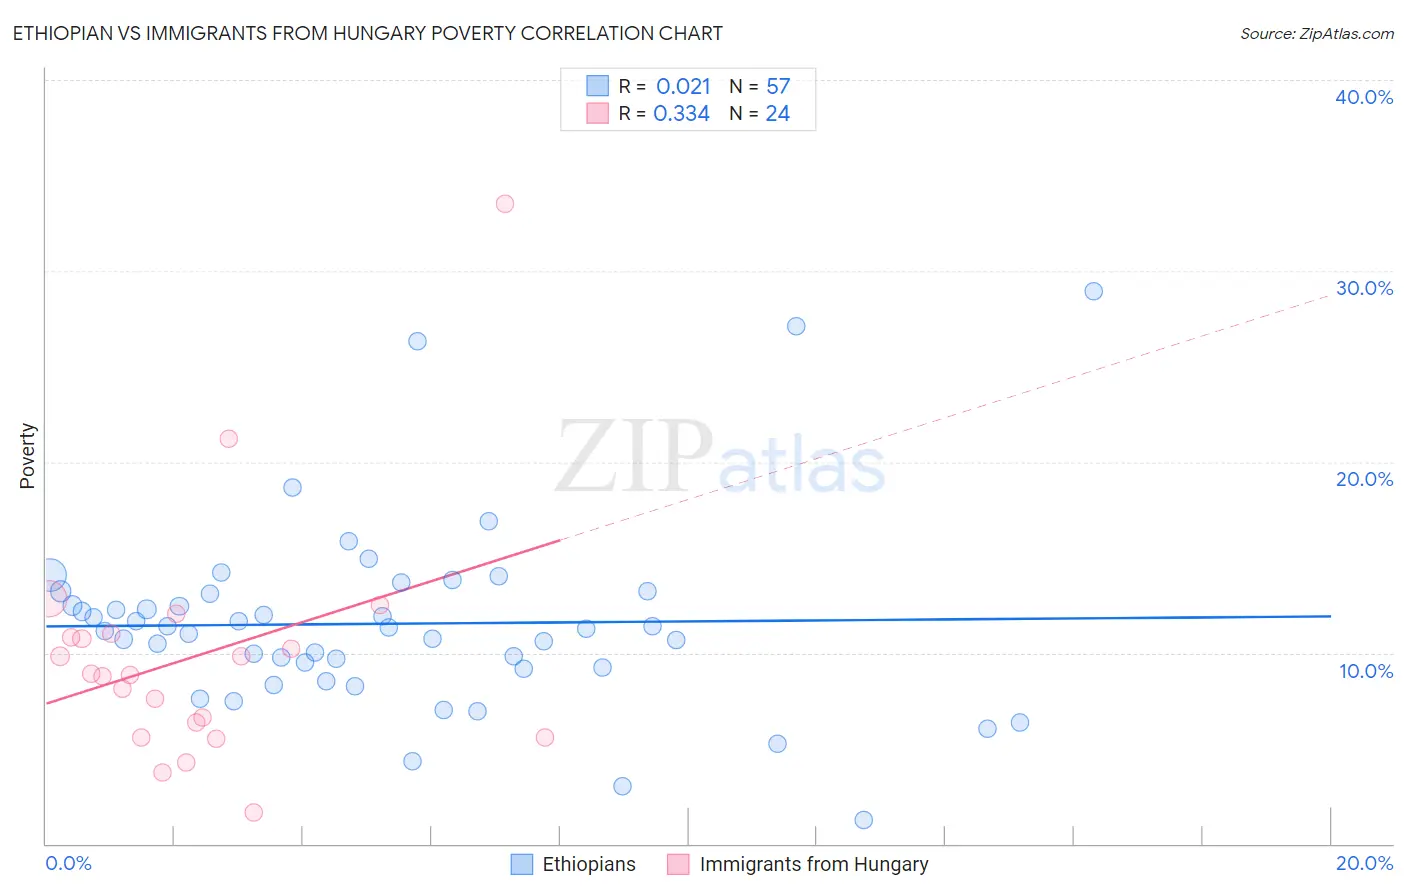
Ethiopian vs Immigrants from Hungary Poverty Correlation Chart

The statistical analysis conducted on geographies consisting of 223,124,419 people shows no correlation between the proportion of Ethiopians and poverty level in the United States with a correlation coefficient (R) of 0.021 and weighted average of 12.2%. Similarly, the statistical analysis conducted on geographies consisting of 195,671,774 people shows a mild positive correlation between the proportion of Immigrants from Hungary and poverty level in the United States with a correlation coefficient (R) of 0.334 and weighted average of 11.7%, a difference of 4.3%.
Ethiopian vs Immigrants from Hungary Poverty

Poverty Correlation Summary

MeasurementEthiopianImmigrants from Hungary
Minimum1.3%1.6%
Maximum28.9%33.5%
Range27.7%31.9%
Mean11.5%9.8%
Median11.3%8.9%
Interquartile 25% (IQ1)9.2%6.0%
Interquartile 75% (IQ3)13.1%10.9%
Interquartile Range (IQR)3.9%4.9%
Standard Deviation (Sample)5.0%6.4%
Standard Deviation (Population)4.9%6.3%

Similar Demographics by Poverty

Demographics Similar to Ethiopians by Poverty

In terms of poverty, the demographic groups most similar to Ethiopians are Immigrants from Fiji (12.2%, a difference of 0.010%), Immigrants from Ethiopia (12.2%, a difference of 0.050%), Colombian (12.2%, a difference of 0.12%), Immigrants from Nepal (12.2%, a difference of 0.13%), and Immigrants from Albania (12.2%, a difference of 0.13%).
DemographicsRating | RankPoverty
Hungarians
63.6
/100
|
#155
Good
12.2%
Scotch-Irish
62.6
/100
|
#156
Good
12.2%
Costa Ricans
62.2
/100
|
#157
Good
12.2%
Taiwanese
61.8
/100
|
#158
Good
12.2%
Pennsylvania Germans
60.8
/100
|
#159
Good
12.2%
Immigrants | Nepal
60.4
/100
|
#160
Good
12.2%
Immigrants | Fiji
59.1
/100
|
#161
Average
12.2%
Ethiopians
59.1
/100
|
#162
Average
12.2%
Immigrants | Ethiopia
58.6
/100
|
#163
Average
12.2%
Colombians
57.8
/100
|
#164
Average
12.2%
Immigrants | Albania
57.7
/100
|
#165
Average
12.2%
Venezuelans
56.9
/100
|
#166
Average
12.2%
Immigrants | Chile
56.7
/100
|
#167
Average
12.2%
Immigrants | Venezuela
56.5
/100
|
#168
Average
12.2%
Whites/Caucasians
55.4
/100
|
#169
Average
12.3%

Demographics Similar to Immigrants from Hungary by Poverty

In terms of poverty, the demographic groups most similar to Immigrants from Hungary are New Zealander (11.7%, a difference of 0.020%), Puget Sound Salish (11.7%, a difference of 0.020%), Soviet Union (11.7%, a difference of 0.070%), Immigrants from South Eastern Asia (11.7%, a difference of 0.080%), and Tlingit-Haida (11.7%, a difference of 0.090%).
DemographicsRating | RankPoverty
Immigrants | Russia
89.7
/100
|
#116
Excellent
11.7%
Sri Lankans
89.4
/100
|
#117
Excellent
11.7%
Argentineans
89.1
/100
|
#118
Excellent
11.7%
Tlingit-Haida
89.0
/100
|
#119
Excellent
11.7%
Immigrants | South Eastern Asia
88.9
/100
|
#120
Excellent
11.7%
New Zealanders
88.7
/100
|
#121
Excellent
11.7%
Puget Sound Salish
88.7
/100
|
#122
Excellent
11.7%
Immigrants | Hungary
88.6
/100
|
#123
Excellent
11.7%
Soviet Union
88.4
/100
|
#124
Excellent
11.7%
Immigrants | Brazil
88.2
/100
|
#125
Excellent
11.7%
Immigrants | Norway
88.0
/100
|
#126
Excellent
11.7%
Immigrants | Argentina
88.0
/100
|
#127
Excellent
11.7%
Immigrants | Israel
87.4
/100
|
#128
Excellent
11.7%
South Africans
87.0
/100
|
#129
Excellent
11.7%
Immigrants | Ukraine
86.6
/100
|
#130
Excellent
11.8%