Seminole vs Czechoslovakian Poverty
COMPARE
Seminole
Czechoslovakian
Poverty
Poverty Comparison
Seminole
Czechoslovakians
15.6%
POVERTY
0.0/ 100
METRIC RATING
309th/ 347
METRIC RANK
11.4%
POVERTY
95.7/ 100
METRIC RATING
89th/ 347
METRIC RANK
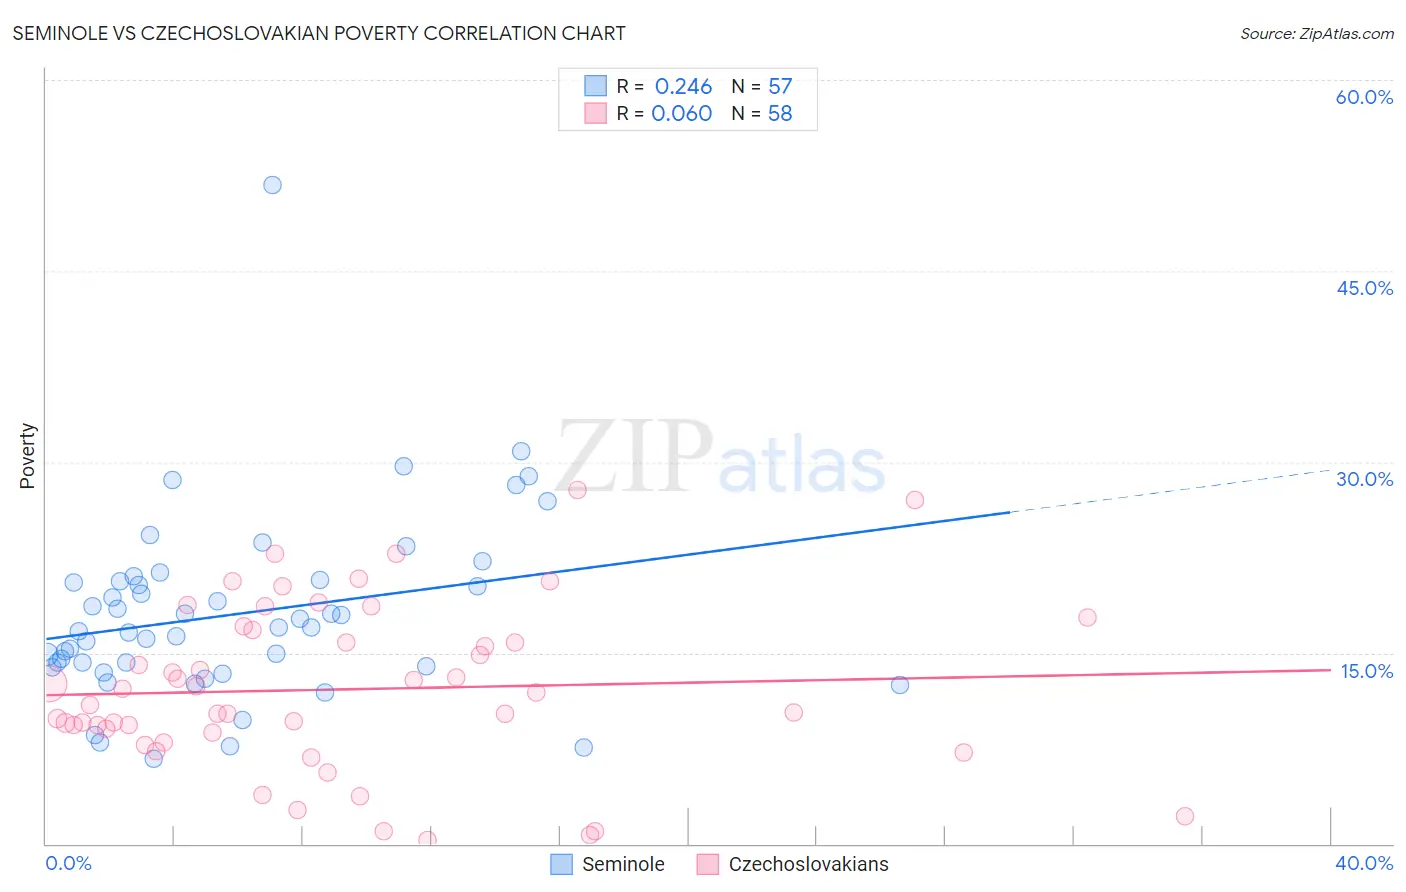
Seminole vs Czechoslovakian Poverty Correlation Chart
The statistical analysis conducted on geographies consisting of 118,300,623 people shows a weak positive correlation between the proportion of Seminole and poverty level in the United States with a correlation coefficient (R) of 0.246 and weighted average of 15.6%. Similarly, the statistical analysis conducted on geographies consisting of 368,518,810 people shows a slight positive correlation between the proportion of Czechoslovakians and poverty level in the United States with a correlation coefficient (R) of 0.060 and weighted average of 11.4%, a difference of 37.0%.
Poverty Correlation Summary
| Measurement | Seminole | Czechoslovakian |
| Minimum | 6.7% | 0.33% |
| Maximum | 51.8% | 27.8% |
| Range | 45.1% | 27.5% |
| Mean | 18.0% | 12.1% |
| Median | 16.9% | 11.4% |
| Interquartile 25% (IQ1) | 13.9% | 8.7% |
| Interquartile 75% (IQ3) | 20.7% | 16.8% |
| Interquartile Range (IQR) | 6.8% | 8.1% |
| Standard Deviation (Sample) | 7.3% | 6.5% |
| Standard Deviation (Population) | 7.2% | 6.4% |
Similar Demographics by Poverty
Demographics Similar to Seminole by Poverty
In terms of poverty, the demographic groups most similar to Seminole are Choctaw (15.6%, a difference of 0.040%), Dutch West Indian (15.6%, a difference of 0.090%), African (15.6%, a difference of 0.15%), Creek (15.6%, a difference of 0.23%), and Chippewa (15.7%, a difference of 0.48%).
| Demographics | Rating | Rank | Poverty |
| Somalis | 0.0 /100 | #302 | Tragic 15.4% |
| Immigrants | Caribbean | 0.0 /100 | #303 | Tragic 15.5% |
| Immigrants | Mexico | 0.0 /100 | #304 | Tragic 15.5% |
| Immigrants | Guatemala | 0.0 /100 | #305 | Tragic 15.5% |
| Creek | 0.0 /100 | #306 | Tragic 15.6% |
| Africans | 0.0 /100 | #307 | Tragic 15.6% |
| Choctaw | 0.0 /100 | #308 | Tragic 15.6% |
| Seminole | 0.0 /100 | #309 | Tragic 15.6% |
| Dutch West Indians | 0.0 /100 | #310 | Tragic 15.6% |
| Chippewa | 0.0 /100 | #311 | Tragic 15.7% |
| Cajuns | 0.0 /100 | #312 | Tragic 15.7% |
| Immigrants | Grenada | 0.0 /100 | #313 | Tragic 15.8% |
| Immigrants | Somalia | 0.0 /100 | #314 | Tragic 15.8% |
| British West Indians | 0.0 /100 | #315 | Tragic 15.9% |
| Hondurans | 0.0 /100 | #316 | Tragic 15.9% |
Demographics Similar to Czechoslovakians by Poverty
In terms of poverty, the demographic groups most similar to Czechoslovakians are Belgian (11.4%, a difference of 0.040%), Immigrants from Denmark (11.4%, a difference of 0.17%), Jordanian (11.4%, a difference of 0.18%), Northern European (11.4%, a difference of 0.18%), and Immigrants from England (11.4%, a difference of 0.30%).
| Demographics | Rating | Rank | Poverty |
| Egyptians | 96.5 /100 | #82 | Exceptional 11.3% |
| Immigrants | Sweden | 96.3 /100 | #83 | Exceptional 11.3% |
| English | 96.3 /100 | #84 | Exceptional 11.3% |
| Immigrants | England | 96.2 /100 | #85 | Exceptional 11.4% |
| Jordanians | 96.0 /100 | #86 | Exceptional 11.4% |
| Northern Europeans | 96.0 /100 | #87 | Exceptional 11.4% |
| Belgians | 95.8 /100 | #88 | Exceptional 11.4% |
| Czechoslovakians | 95.7 /100 | #89 | Exceptional 11.4% |
| Immigrants | Denmark | 95.5 /100 | #90 | Exceptional 11.4% |
| Finns | 95.2 /100 | #91 | Exceptional 11.4% |
| British | 95.0 /100 | #92 | Exceptional 11.4% |
| Romanians | 94.9 /100 | #93 | Exceptional 11.4% |
| Paraguayans | 94.9 /100 | #94 | Exceptional 11.4% |
| Australians | 94.9 /100 | #95 | Exceptional 11.4% |
| Immigrants | South Africa | 94.7 /100 | #96 | Exceptional 11.5% |