Immigrants from Belize vs Czechoslovakian Poverty
COMPARE
Immigrants from Belize
Czechoslovakian
Poverty
Poverty Comparison
Immigrants from Belize
Czechoslovakians
15.1%
POVERTY
0.0/ 100
METRIC RATING
289th/ 347
METRIC RANK
11.4%
POVERTY
95.7/ 100
METRIC RATING
89th/ 347
METRIC RANK
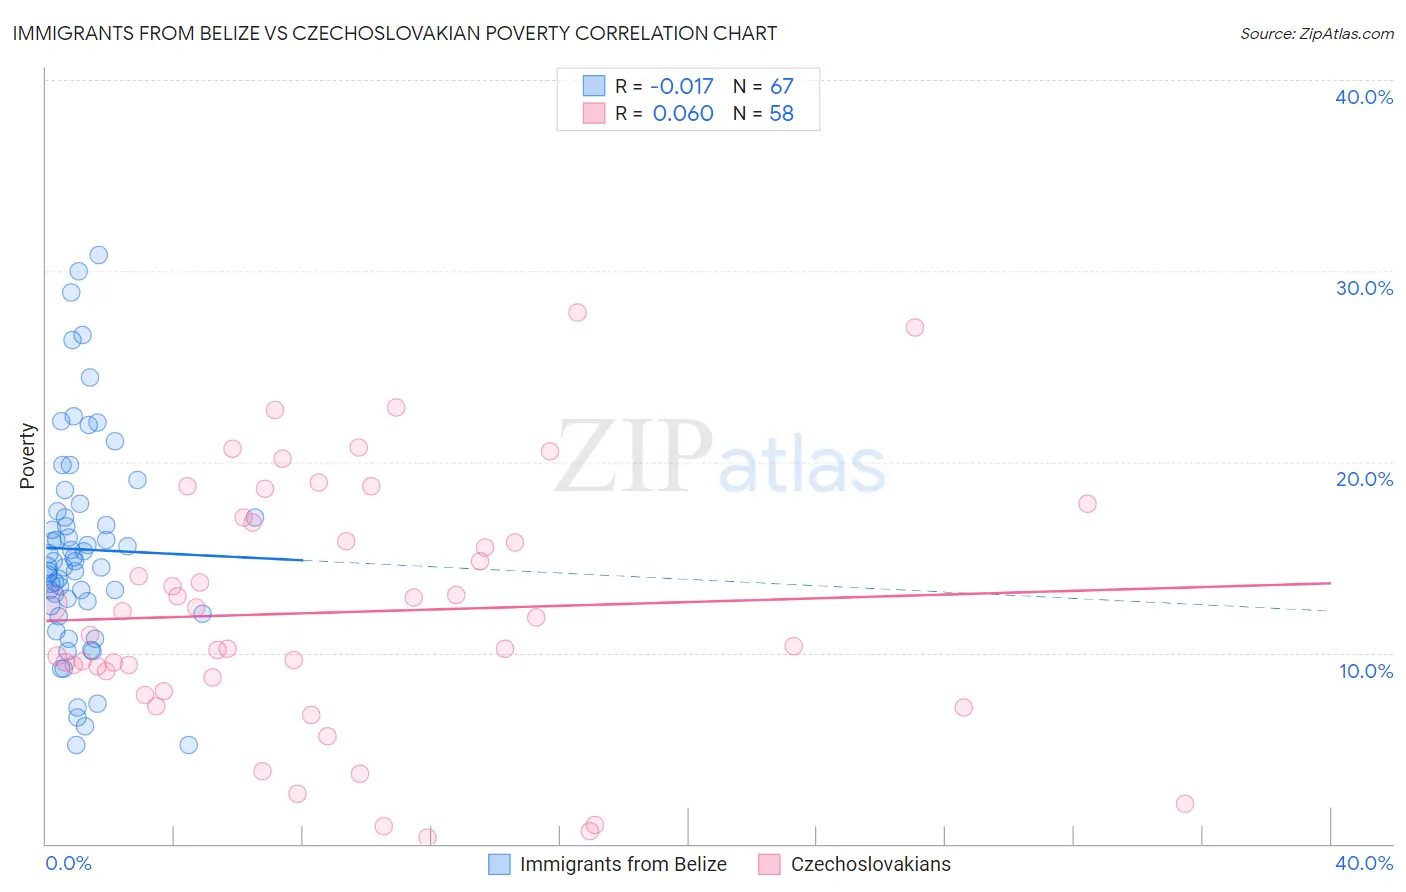
Immigrants from Belize vs Czechoslovakian Poverty Correlation Chart
The statistical analysis conducted on geographies consisting of 130,298,091 people shows no correlation between the proportion of Immigrants from Belize and poverty level in the United States with a correlation coefficient (R) of -0.017 and weighted average of 15.1%. Similarly, the statistical analysis conducted on geographies consisting of 368,518,810 people shows a slight positive correlation between the proportion of Czechoslovakians and poverty level in the United States with a correlation coefficient (R) of 0.060 and weighted average of 11.4%, a difference of 32.5%.
Poverty Correlation Summary
| Measurement | Immigrants from Belize | Czechoslovakian |
| Minimum | 5.2% | 0.33% |
| Maximum | 30.8% | 27.8% |
| Range | 25.7% | 27.5% |
| Mean | 15.4% | 12.1% |
| Median | 14.8% | 11.4% |
| Interquartile 25% (IQ1) | 12.5% | 8.7% |
| Interquartile 75% (IQ3) | 17.4% | 16.8% |
| Interquartile Range (IQR) | 5.0% | 8.1% |
| Standard Deviation (Sample) | 5.6% | 6.5% |
| Standard Deviation (Population) | 5.6% | 6.4% |
Similar Demographics by Poverty
Demographics Similar to Immigrants from Belize by Poverty
In terms of poverty, the demographic groups most similar to Immigrants from Belize are Mexican (15.1%, a difference of 0.10%), Yaqui (15.1%, a difference of 0.12%), Inupiat (15.1%, a difference of 0.13%), Immigrants from Cabo Verde (15.1%, a difference of 0.23%), and Indonesian (15.1%, a difference of 0.28%).
| Demographics | Rating | Rank | Poverty |
| Comanche | 0.0 /100 | #282 | Tragic 15.0% |
| Immigrants | Haiti | 0.0 /100 | #283 | Tragic 15.0% |
| West Indians | 0.0 /100 | #284 | Tragic 15.0% |
| Vietnamese | 0.0 /100 | #285 | Tragic 15.0% |
| Immigrants | Latin America | 0.0 /100 | #286 | Tragic 15.0% |
| Inupiat | 0.0 /100 | #287 | Tragic 15.1% |
| Yaqui | 0.0 /100 | #288 | Tragic 15.1% |
| Immigrants | Belize | 0.0 /100 | #289 | Tragic 15.1% |
| Mexicans | 0.0 /100 | #290 | Tragic 15.1% |
| Immigrants | Cabo Verde | 0.0 /100 | #291 | Tragic 15.1% |
| Indonesians | 0.0 /100 | #292 | Tragic 15.1% |
| Immigrants | Zaire | 0.0 /100 | #293 | Tragic 15.1% |
| Blackfeet | 0.0 /100 | #294 | Tragic 15.2% |
| Guatemalans | 0.0 /100 | #295 | Tragic 15.3% |
| Hispanics or Latinos | 0.0 /100 | #296 | Tragic 15.3% |
Demographics Similar to Czechoslovakians by Poverty
In terms of poverty, the demographic groups most similar to Czechoslovakians are Belgian (11.4%, a difference of 0.040%), Immigrants from Denmark (11.4%, a difference of 0.17%), Jordanian (11.4%, a difference of 0.18%), Northern European (11.4%, a difference of 0.18%), and Immigrants from England (11.4%, a difference of 0.30%).
| Demographics | Rating | Rank | Poverty |
| Egyptians | 96.5 /100 | #82 | Exceptional 11.3% |
| Immigrants | Sweden | 96.3 /100 | #83 | Exceptional 11.3% |
| English | 96.3 /100 | #84 | Exceptional 11.3% |
| Immigrants | England | 96.2 /100 | #85 | Exceptional 11.4% |
| Jordanians | 96.0 /100 | #86 | Exceptional 11.4% |
| Northern Europeans | 96.0 /100 | #87 | Exceptional 11.4% |
| Belgians | 95.8 /100 | #88 | Exceptional 11.4% |
| Czechoslovakians | 95.7 /100 | #89 | Exceptional 11.4% |
| Immigrants | Denmark | 95.5 /100 | #90 | Exceptional 11.4% |
| Finns | 95.2 /100 | #91 | Exceptional 11.4% |
| British | 95.0 /100 | #92 | Exceptional 11.4% |
| Romanians | 94.9 /100 | #93 | Exceptional 11.4% |
| Paraguayans | 94.9 /100 | #94 | Exceptional 11.4% |
| Australians | 94.9 /100 | #95 | Exceptional 11.4% |
| Immigrants | South Africa | 94.7 /100 | #96 | Exceptional 11.5% |