Ecuadorian vs Immigrants from Netherlands Male Poverty
COMPARE
Ecuadorian
Immigrants from Netherlands
Male Poverty
Male Poverty Comparison
Ecuadorians
Immigrants from Netherlands
12.7%
MALE POVERTY
0.4/ 100
METRIC RATING
238th/ 347
METRIC RANK
10.2%
MALE POVERTY
97.3/ 100
METRIC RATING
67th/ 347
METRIC RANK
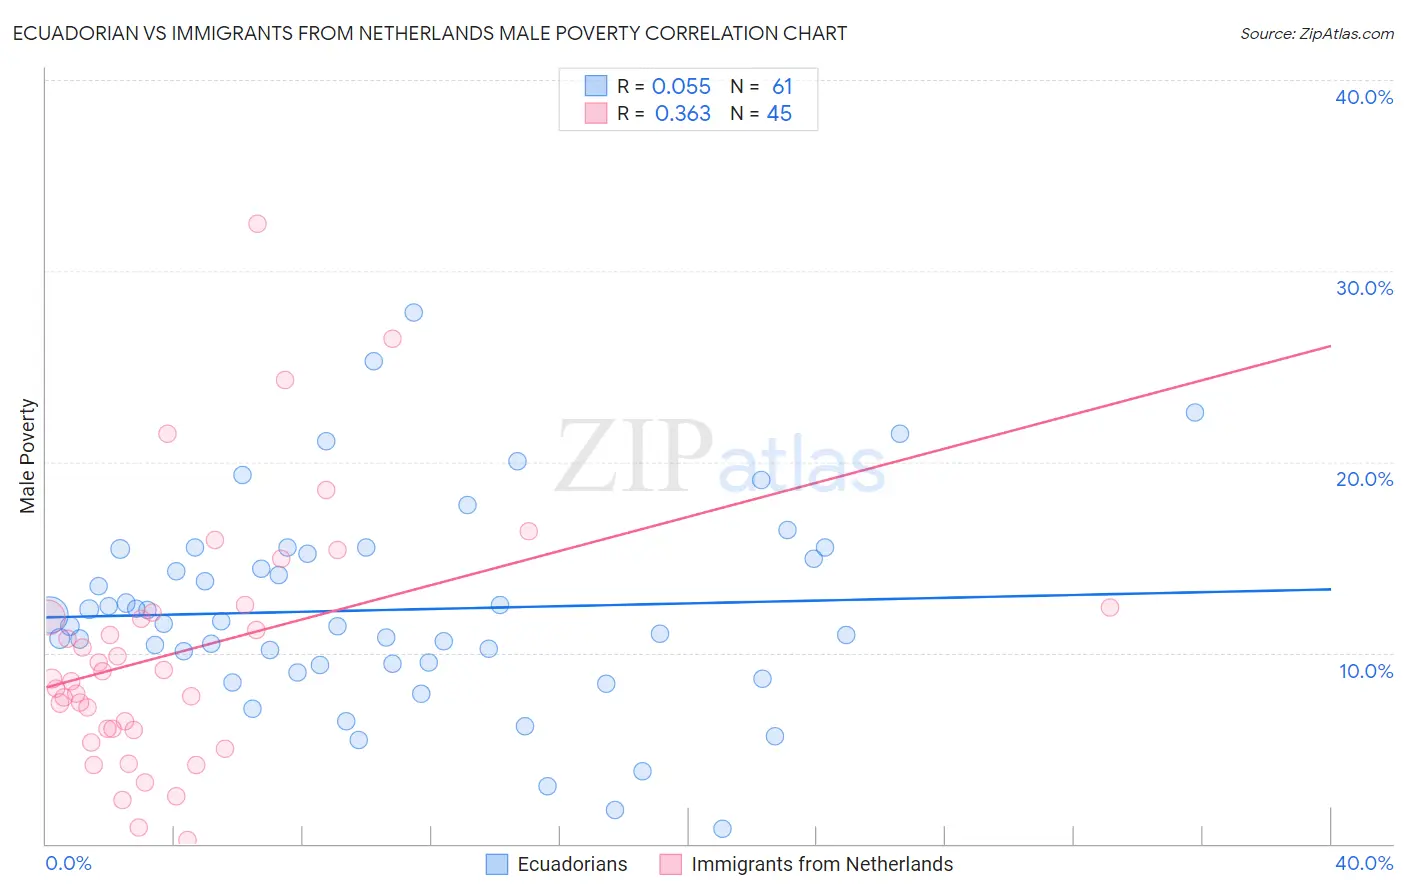
Ecuadorian vs Immigrants from Netherlands Male Poverty Correlation Chart
The statistical analysis conducted on geographies consisting of 317,549,368 people shows a slight positive correlation between the proportion of Ecuadorians and poverty level among males in the United States with a correlation coefficient (R) of 0.055 and weighted average of 12.7%. Similarly, the statistical analysis conducted on geographies consisting of 237,754,800 people shows a mild positive correlation between the proportion of Immigrants from Netherlands and poverty level among males in the United States with a correlation coefficient (R) of 0.363 and weighted average of 10.2%, a difference of 24.3%.
Male Poverty Correlation Summary
| Measurement | Ecuadorian | Immigrants from Netherlands |
| Minimum | 0.81% | 0.21% |
| Maximum | 27.8% | 32.5% |
| Range | 27.0% | 32.3% |
| Mean | 12.3% | 10.1% |
| Median | 11.6% | 8.7% |
| Interquartile 25% (IQ1) | 9.4% | 6.0% |
| Interquartile 75% (IQ3) | 15.3% | 12.3% |
| Interquartile Range (IQR) | 6.0% | 6.3% |
| Standard Deviation (Sample) | 5.3% | 6.6% |
| Standard Deviation (Population) | 5.3% | 6.6% |
Similar Demographics by Male Poverty
Demographics Similar to Ecuadorians by Male Poverty
In terms of male poverty, the demographic groups most similar to Ecuadorians are Ghanaian (12.7%, a difference of 0.0%), French American Indian (12.7%, a difference of 0.030%), Immigrants from Saudi Arabia (12.7%, a difference of 0.080%), Immigrants from Middle Africa (12.7%, a difference of 0.28%), and Immigrants from Laos (12.6%, a difference of 0.32%).
| Demographics | Rating | Rank | Male Poverty |
| Salvadorans | 0.6 /100 | #231 | Tragic 12.6% |
| Nicaraguans | 0.6 /100 | #232 | Tragic 12.6% |
| Fijians | 0.6 /100 | #233 | Tragic 12.6% |
| Immigrants | Armenia | 0.6 /100 | #234 | Tragic 12.6% |
| Immigrants | Laos | 0.5 /100 | #235 | Tragic 12.6% |
| Immigrants | Saudi Arabia | 0.4 /100 | #236 | Tragic 12.7% |
| French American Indians | 0.4 /100 | #237 | Tragic 12.7% |
| Ecuadorians | 0.4 /100 | #238 | Tragic 12.7% |
| Ghanaians | 0.4 /100 | #239 | Tragic 12.7% |
| Immigrants | Middle Africa | 0.4 /100 | #240 | Tragic 12.7% |
| Sudanese | 0.3 /100 | #241 | Tragic 12.8% |
| Nepalese | 0.3 /100 | #242 | Tragic 12.8% |
| Alaskan Athabascans | 0.3 /100 | #243 | Tragic 12.8% |
| Tsimshian | 0.3 /100 | #244 | Tragic 12.8% |
| Liberians | 0.3 /100 | #245 | Tragic 12.8% |
Demographics Similar to Immigrants from Netherlands by Male Poverty
In terms of male poverty, the demographic groups most similar to Immigrants from Netherlands are Immigrants from Sri Lanka (10.2%, a difference of 0.050%), Serbian (10.2%, a difference of 0.17%), Zimbabwean (10.2%, a difference of 0.18%), Immigrants from Australia (10.2%, a difference of 0.18%), and Paraguayan (10.2%, a difference of 0.20%).
| Demographics | Rating | Rank | Male Poverty |
| Ukrainians | 97.9 /100 | #60 | Exceptional 10.1% |
| Austrians | 97.8 /100 | #61 | Exceptional 10.1% |
| Immigrants | Italy | 97.8 /100 | #62 | Exceptional 10.2% |
| Slovaks | 97.7 /100 | #63 | Exceptional 10.2% |
| Swiss | 97.5 /100 | #64 | Exceptional 10.2% |
| Zimbabweans | 97.5 /100 | #65 | Exceptional 10.2% |
| Serbians | 97.5 /100 | #66 | Exceptional 10.2% |
| Immigrants | Netherlands | 97.3 /100 | #67 | Exceptional 10.2% |
| Immigrants | Sri Lanka | 97.2 /100 | #68 | Exceptional 10.2% |
| Immigrants | Australia | 97.1 /100 | #69 | Exceptional 10.2% |
| Paraguayans | 97.1 /100 | #70 | Exceptional 10.2% |
| Europeans | 97.1 /100 | #71 | Exceptional 10.2% |
| Immigrants | Canada | 97.1 /100 | #72 | Exceptional 10.2% |
| Immigrants | Asia | 97.0 /100 | #73 | Exceptional 10.2% |
| Immigrants | Eastern Europe | 96.9 /100 | #74 | Exceptional 10.2% |