Ecuadorian vs Immigrants from Netherlands In Labor Force | Age 20-64
COMPARE
Ecuadorian
Immigrants from Netherlands
In Labor Force | Age 20-64
In Labor Force | Age 20-64 Comparison
Ecuadorians
Immigrants from Netherlands
79.4%
IN LABOR FORCE | AGE 20-64
23.1/ 100
METRIC RATING
196th/ 347
METRIC RANK
79.5%
IN LABOR FORCE | AGE 20-64
45.2/ 100
METRIC RATING
177th/ 347
METRIC RANK
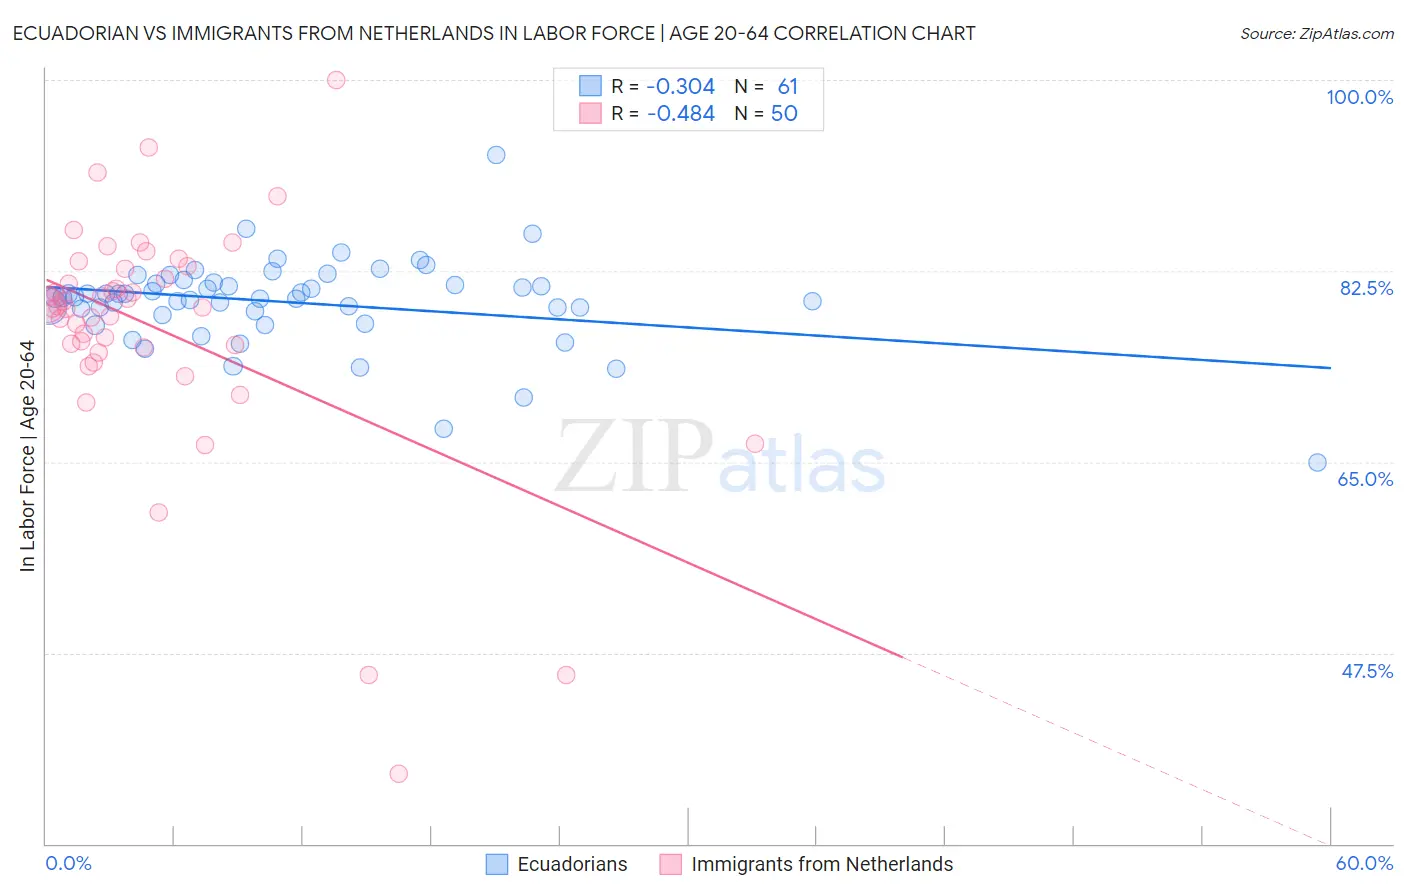
Ecuadorian vs Immigrants from Netherlands In Labor Force | Age 20-64 Correlation Chart
The statistical analysis conducted on geographies consisting of 317,839,465 people shows a mild negative correlation between the proportion of Ecuadorians and labor force participation rate among population between the ages 20 and 64 in the United States with a correlation coefficient (R) of -0.304 and weighted average of 79.4%. Similarly, the statistical analysis conducted on geographies consisting of 237,882,081 people shows a moderate negative correlation between the proportion of Immigrants from Netherlands and labor force participation rate among population between the ages 20 and 64 in the United States with a correlation coefficient (R) of -0.484 and weighted average of 79.5%, a difference of 0.20%.
In Labor Force | Age 20-64 Correlation Summary
| Measurement | Ecuadorian | Immigrants from Netherlands |
| Minimum | 65.0% | 36.4% |
| Maximum | 93.1% | 100.0% |
| Range | 28.1% | 63.6% |
| Mean | 79.6% | 77.2% |
| Median | 80.1% | 79.2% |
| Interquartile 25% (IQ1) | 78.7% | 75.5% |
| Interquartile 75% (IQ3) | 81.4% | 82.7% |
| Interquartile Range (IQR) | 2.7% | 7.2% |
| Standard Deviation (Sample) | 4.1% | 11.1% |
| Standard Deviation (Population) | 4.1% | 11.0% |
Demographics Similar to Ecuadorians and Immigrants from Netherlands by In Labor Force | Age 20-64
In terms of in labor force | age 20-64, the demographic groups most similar to Ecuadorians are Immigrants from Austria (79.4%, a difference of 0.010%), Immigrants from Thailand (79.4%, a difference of 0.020%), Indonesian (79.4%, a difference of 0.030%), Immigrants from Denmark (79.4%, a difference of 0.040%), and Swiss (79.4%, a difference of 0.060%). Similarly, the demographic groups most similar to Immigrants from Netherlands are Australian (79.5%, a difference of 0.010%), Czechoslovakian (79.5%, a difference of 0.010%), Armenian (79.5%, a difference of 0.030%), Salvadoran (79.5%, a difference of 0.030%), and Immigrants from Saudi Arabia (79.5%, a difference of 0.060%).
| Demographics | Rating | Rank | In Labor Force | Age 20-64 |
| Australians | 46.0 /100 | #176 | Average 79.5% |
| Immigrants | Netherlands | 45.2 /100 | #177 | Average 79.5% |
| Czechoslovakians | 44.3 /100 | #178 | Average 79.5% |
| Armenians | 41.4 /100 | #179 | Average 79.5% |
| Salvadorans | 41.0 /100 | #180 | Average 79.5% |
| Immigrants | Saudi Arabia | 37.7 /100 | #181 | Fair 79.5% |
| Malaysians | 37.1 /100 | #182 | Fair 79.5% |
| Immigrants | Hungary | 36.8 /100 | #183 | Fair 79.5% |
| Finns | 35.9 /100 | #184 | Fair 79.5% |
| Israelis | 34.7 /100 | #185 | Fair 79.5% |
| Northern Europeans | 34.5 /100 | #186 | Fair 79.5% |
| Assyrians/Chaldeans/Syriacs | 33.3 /100 | #187 | Fair 79.4% |
| Immigrants | Haiti | 32.1 /100 | #188 | Fair 79.4% |
| Immigrants | El Salvador | 30.9 /100 | #189 | Fair 79.4% |
| Immigrants | Syria | 30.8 /100 | #190 | Fair 79.4% |
| Swiss | 28.9 /100 | #191 | Fair 79.4% |
| Immigrants | Denmark | 26.9 /100 | #192 | Fair 79.4% |
| Indonesians | 26.1 /100 | #193 | Fair 79.4% |
| Immigrants | Thailand | 24.8 /100 | #194 | Fair 79.4% |
| Immigrants | Austria | 23.7 /100 | #195 | Fair 79.4% |
| Ecuadorians | 23.1 /100 | #196 | Fair 79.4% |