Comanche vs Immigrants from Oceania Single Female Poverty

COMPARE

Comanche
Race
Ancestry
AfghanAfricanAlaska NativeAlaskan AthabascanAlbanianAleutAlsatianAmericanApacheArabArapahoArgentineanArmenianAssyrian/Chaldean/SyriacAustralianAustrianBahamianBangladeshiBarbadianBasqueBelgianBelizeanBermudanBhutaneseBlackfeetBolivianBrazilianBritishBritish West IndianBulgarianBurmeseCajunCambodianCanadianCape VerdeanCarpatho RusynCelticCentral AmericanCentral American IndianCherokeeCheyenneChickasawChileanChineseChippewaChoctawColombianColvilleComancheCosta RicanCreeCreekCroatianCrowCubanCypriotCzechCzechoslovakianDanishDelawareDominicanDutchDutch West IndianEastern EuropeanEcuadorianEgyptianEnglishEstonianEthiopianEuropeanFijianFilipinoFinnishFrenchFrench American IndianFrench CanadianGermanGerman RussianGhanaianGreekGuamanian/ChamorroGuatemalanGuyaneseHaitianHmongHonduranHopiHoumaHungarianIcelanderIndian (Asian)IndonesianInupiatIranianIraqiIrishIroquoisIsraeliItalianJamaicanJapaneseJordanianKenyanKiowaKoreanLaotianLatvianLebaneseLiberianLithuanianLumbeeLuxembourgerMacedonianMalaysianMalteseMarshalleseMenomineeMexicanMexican American IndianMongolianMoroccanNative HawaiianNavajoNepaleseNew ZealanderNicaraguanNigerianNorthern EuropeanNorwegianOkinawanOsageOttawaPaiutePakistaniPalestinianPanamanianParaguayanPennsylvania GermanPeruvianPimaPolishPortuguesePotawatomiPuebloPuerto RicanPuget Sound SalishRomanianRussianSalvadoranSamoanScandinavianScotch-IrishScottishSeminoleSenegaleseSerbianShoshoneSierra LeoneanSiouxSlavicSlovakSloveneSomaliSouth AfricanSouth AmericanSouth American IndianSoviet UnionSpaniardSpanishSpanish AmericanSpanish American IndianSri LankanSubsaharan AfricanSudaneseSwedishSwissSyrianTaiwaneseThaiTlingit-HaidaTohono O'OdhamTonganTrinidadian and TobagonianTsimshianTurkishU.S. Virgin IslanderUgandanUkrainianUruguayanUteVenezuelanVietnameseWelshWest IndianYakamaYaquiYugoslavianYumanYup'ikZimbabwean
Immigration
NonimmigrantsImmigrantsAfghanistanAfricaAlbaniaArgentinaArmeniaAsiaAustraliaAustriaBahamasBangladeshBarbadosBelarusBelgiumBelizeBoliviaBosnia and HerzegovinaBrazilBulgariaBurma/MyanmarCabo VerdeCambodiaCameroonCanadaCaribbeanCentral AmericaChileChinaColombiaCongoCosta RicaCroatiaCubaCzechoslovakiaDenmarkDominicaDominican RepublicEastern AfricaEastern AsiaEastern EuropeEcuadorEgyptEl SalvadorEnglandEritreaEthiopiaEuropeFijiFranceGermanyGhanaGreeceGrenadaGuatemalaGuyanaHaitiHondurasHong KongHungaryIndiaIndonesiaIranIraqIrelandIsraelItalyJamaicaJapanJordanKazakhstanKenyaKoreaKuwaitLaosLatin AmericaLatviaLebanonLiberiaLithuaniaMalaysiaMexicoMicronesiaMiddle AfricaMoldovaMoroccoNepalNetherlandsNicaraguaNigeriaNorth AmericaNorth MacedoniaNorthern AfricaNorthern EuropeNorwayPakistanPanamaPeruPhilippinesPolandPortugalRomaniaRussiaSaudi ArabiaScotlandSenegalSerbiaSierra LeoneSingaporeSomaliaSouth AfricaSouth AmericaSouth Central AsiaSouth Eastern AsiaSouthern EuropeSpainSri LankaSt. Vincent and the GrenadinesSudanSwedenSwitzerlandSyriaTaiwanThailandTrinidad and TobagoTurkeyUgandaUkraineUruguayUzbekistanVenezuelaVietnamWest IndiesWestern AfricaWestern AsiaWestern EuropeYemenZaireZimbabweAzores
Immigrants from Oceania
Race
Ancestry
AfghanAfricanAlaska NativeAlaskan AthabascanAlbanianAleutAlsatianAmericanApacheArabArapahoArgentineanArmenianAssyrian/Chaldean/SyriacAustralianAustrianBahamianBangladeshiBarbadianBasqueBelgianBelizeanBermudanBhutaneseBlackfeetBolivianBrazilianBritishBritish West IndianBulgarianBurmeseCajunCambodianCanadianCape VerdeanCarpatho RusynCelticCentral AmericanCentral American IndianCherokeeCheyenneChickasawChileanChineseChippewaChoctawColombianColvilleCosta RicanCreeCreekCroatianCrowCubanCypriotCzechCzechoslovakianDanishDelawareDominicanDutchDutch West IndianEastern EuropeanEcuadorianEgyptianEnglishEstonianEthiopianEuropeanFijianFilipinoFinnishFrenchFrench American IndianFrench CanadianGermanGerman RussianGhanaianGreekGuamanian/ChamorroGuatemalanGuyaneseHaitianHmongHonduranHopiHoumaHungarianIcelanderIndian (Asian)IndonesianInupiatIranianIraqiIrishIroquoisIsraeliItalianJamaicanJapaneseJordanianKenyanKiowaKoreanLaotianLatvianLebaneseLiberianLithuanianLumbeeLuxembourgerMacedonianMalaysianMalteseMarshalleseMenomineeMexicanMexican American IndianMongolianMoroccanNative HawaiianNavajoNepaleseNew ZealanderNicaraguanNigerianNorthern EuropeanNorwegianOkinawanOsageOttawaPaiutePakistaniPalestinianPanamanianParaguayanPennsylvania GermanPeruvianPimaPolishPortuguesePotawatomiPuebloPuerto RicanPuget Sound SalishRomanianRussianSalvadoranSamoanScandinavianScotch-IrishScottishSeminoleSenegaleseSerbianShoshoneSierra LeoneanSiouxSlavicSlovakSloveneSomaliSouth AfricanSouth AmericanSouth American IndianSoviet UnionSpaniardSpanishSpanish AmericanSpanish American IndianSri LankanSubsaharan AfricanSudaneseSwedishSwissSyrianTaiwaneseThaiTlingit-HaidaTohono O'OdhamTonganTrinidadian and TobagonianTsimshianTurkishU.S. Virgin IslanderUgandanUkrainianUruguayanUteVenezuelanVietnameseWelshWest IndianYakamaYaquiYugoslavianYumanYup'ikZimbabwean
Immigration
NonimmigrantsImmigrantsAfghanistanAfricaAlbaniaArgentinaArmeniaAsiaAustraliaAustriaBahamasBangladeshBarbadosBelarusBelgiumBelizeBoliviaBosnia and HerzegovinaBrazilBulgariaBurma/MyanmarCabo VerdeCambodiaCameroonCanadaCaribbeanCentral AmericaChileChinaColombiaCongoCosta RicaCroatiaCubaCzechoslovakiaDenmarkDominicaDominican RepublicEastern AfricaEastern AsiaEastern EuropeEcuadorEgyptEl SalvadorEnglandEritreaEthiopiaEuropeFijiFranceGermanyGhanaGreeceGrenadaGuatemalaGuyanaHaitiHondurasHong KongHungaryIndiaIndonesiaIranIraqIrelandIsraelItalyJamaicaJapanJordanKazakhstanKenyaKoreaKuwaitLaosLatin AmericaLatviaLebanonLiberiaLithuaniaMalaysiaMexicoMicronesiaMiddle AfricaMoldovaMoroccoNepalNetherlandsNicaraguaNigeriaNorth AmericaNorth MacedoniaNorthern AfricaNorthern EuropeNorwayOceaniaPakistanPanamaPeruPhilippinesPolandPortugalRomaniaRussiaSaudi ArabiaScotlandSenegalSerbiaSierra LeoneSingaporeSomaliaSouth AfricaSouth AmericaSouth Central AsiaSouth Eastern AsiaSouthern EuropeSpainSri LankaSt. Vincent and the GrenadinesSudanSwedenSwitzerlandSyriaTaiwanThailandTrinidad and TobagoTurkeyUgandaUkraineUruguayUzbekistanVenezuelaVietnamWest IndiesWestern AfricaWestern AsiaWestern EuropeYemenZaireZimbabweAzores
Single Female Poverty
Income
Poverty
Unemployment
Labor Participation
Family Structure
Vehicle Availability
Education Level
Disability

Single Female Poverty Comparison

Comanche

Immigrants from Oceania

Tragic
Good
25.6%
SINGLE FEMALE POVERTY
0.0/ 100
METRIC RATING
313th/ 347
METRIC RANK
20.7%
SINGLE FEMALE POVERTY
74.3/ 100
METRIC RATING
157th/ 347
METRIC RANK

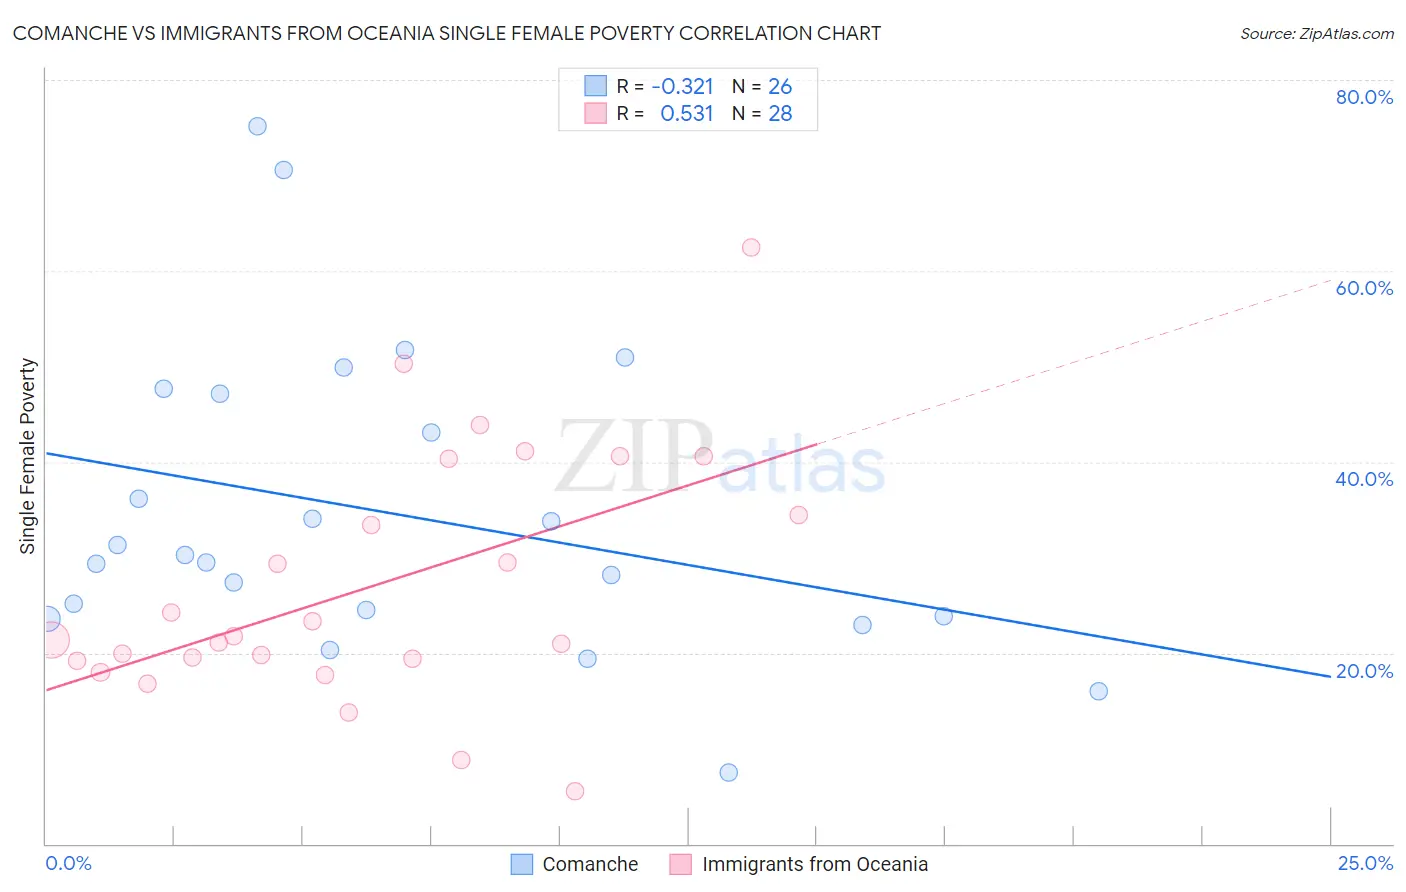
Comanche vs Immigrants from Oceania Single Female Poverty Correlation Chart

The statistical analysis conducted on geographies consisting of 109,354,794 people shows a mild negative correlation between the proportion of Comanche and poverty level among single females in the United States with a correlation coefficient (R) of -0.321 and weighted average of 25.6%. Similarly, the statistical analysis conducted on geographies consisting of 301,448,754 people shows a substantial positive correlation between the proportion of Immigrants from Oceania and poverty level among single females in the United States with a correlation coefficient (R) of 0.531 and weighted average of 20.7%, a difference of 23.7%.
Comanche vs Immigrants from Oceania Single Female Poverty

Single Female Poverty Correlation Summary

MeasurementComancheImmigrants from Oceania
Minimum7.4%5.6%
Maximum75.2%62.5%
Range67.8%56.9%
Mean34.6%27.0%
Median29.9%21.6%
Interquartile 25% (IQ1)23.8%19.3%
Interquartile 75% (IQ3)47.1%37.4%
Interquartile Range (IQR)23.3%18.1%
Standard Deviation (Sample)16.0%13.1%
Standard Deviation (Population)15.7%12.8%

Similar Demographics by Single Female Poverty

Demographics Similar to Comanche by Single Female Poverty

In terms of single female poverty, the demographic groups most similar to Comanche are Paiute (25.5%, a difference of 0.11%), Immigrants from Honduras (25.5%, a difference of 0.16%), Cherokee (25.7%, a difference of 0.36%), Central American Indian (25.5%, a difference of 0.44%), and Dominican (25.4%, a difference of 0.59%).
DemographicsRating | RankSingle Female Poverty
Immigrants | Mexico
0.0
/100
|
#306
Tragic
25.3%
Potawatomi
0.0
/100
|
#307
Tragic
25.4%
Aleuts
0.0
/100
|
#308
Tragic
25.4%
Dominicans
0.0
/100
|
#309
Tragic
25.4%
Central American Indians
0.0
/100
|
#310
Tragic
25.5%
Immigrants | Honduras
0.0
/100
|
#311
Tragic
25.5%
Paiute
0.0
/100
|
#312
Tragic
25.5%
Comanche
0.0
/100
|
#313
Tragic
25.6%
Cherokee
0.0
/100
|
#314
Tragic
25.7%
Iroquois
0.0
/100
|
#315
Tragic
25.7%
Immigrants | Somalia
0.0
/100
|
#316
Tragic
25.8%
Ottawa
0.0
/100
|
#317
Tragic
26.0%
Chickasaw
0.0
/100
|
#318
Tragic
26.3%
Blacks/African Americans
0.0
/100
|
#319
Tragic
26.4%
Arapaho
0.0
/100
|
#320
Tragic
26.4%

Demographics Similar to Immigrants from Oceania by Single Female Poverty

In terms of single female poverty, the demographic groups most similar to Immigrants from Oceania are Danish (20.7%, a difference of 0.11%), South American Indian (20.6%, a difference of 0.12%), Samoan (20.6%, a difference of 0.15%), Costa Rican (20.7%, a difference of 0.20%), and Immigrants from Western Europe (20.6%, a difference of 0.21%).
DemographicsRating | RankSingle Female Poverty
Immigrants | Denmark
80.5
/100
|
#150
Excellent
20.5%
Puget Sound Salish
79.6
/100
|
#151
Good
20.6%
Immigrants | Uruguay
77.7
/100
|
#152
Good
20.6%
Swedes
77.1
/100
|
#153
Good
20.6%
Immigrants | Western Europe
76.7
/100
|
#154
Good
20.6%
Samoans
76.0
/100
|
#155
Good
20.6%
South American Indians
75.7
/100
|
#156
Good
20.6%
Immigrants | Oceania
74.3
/100
|
#157
Good
20.7%
Danes
73.0
/100
|
#158
Good
20.7%
Costa Ricans
71.8
/100
|
#159
Good
20.7%
Arabs
70.8
/100
|
#160
Good
20.7%
Kenyans
68.5
/100
|
#161
Good
20.8%
Northern Europeans
68.4
/100
|
#162
Good
20.8%
Lebanese
67.6
/100
|
#163
Good
20.8%
Iraqis
64.5
/100
|
#164
Good
20.8%