Comanche vs Immigrants from Micronesia Single Female Poverty
COMPARE
Comanche
Immigrants from Micronesia
Single Female Poverty
Single Female Poverty Comparison
Comanche
Immigrants from Micronesia
25.6%
SINGLE FEMALE POVERTY
0.0/ 100
METRIC RATING
313th/ 347
METRIC RANK
23.0%
SINGLE FEMALE POVERTY
0.2/ 100
METRIC RATING
266th/ 347
METRIC RANK
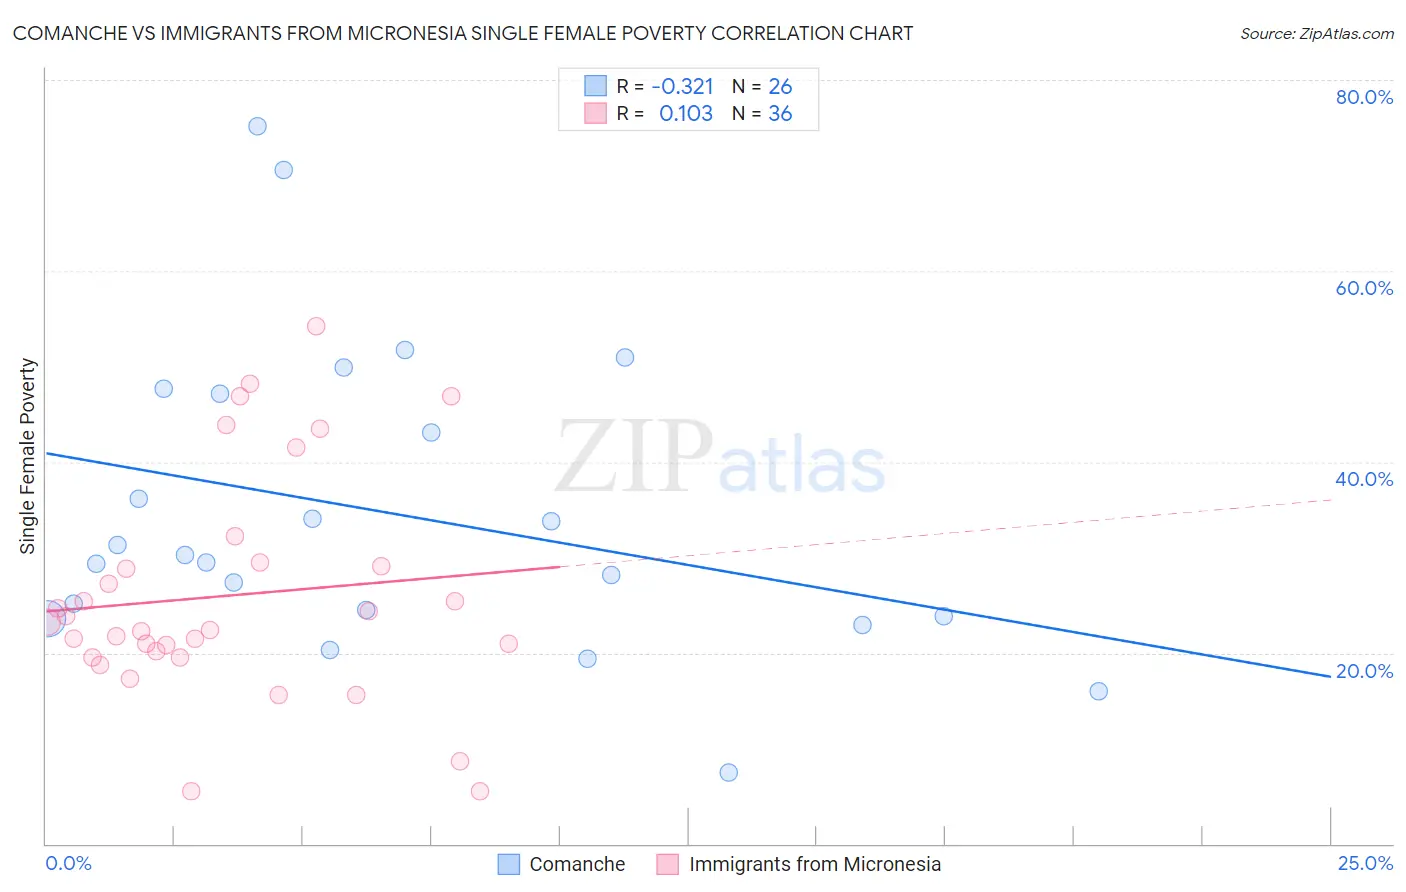
Comanche vs Immigrants from Micronesia Single Female Poverty Correlation Chart
The statistical analysis conducted on geographies consisting of 109,354,794 people shows a mild negative correlation between the proportion of Comanche and poverty level among single females in the United States with a correlation coefficient (R) of -0.321 and weighted average of 25.6%. Similarly, the statistical analysis conducted on geographies consisting of 61,492,731 people shows a poor positive correlation between the proportion of Immigrants from Micronesia and poverty level among single females in the United States with a correlation coefficient (R) of 0.103 and weighted average of 23.0%, a difference of 11.0%.
Single Female Poverty Correlation Summary
| Measurement | Comanche | Immigrants from Micronesia |
| Minimum | 7.4% | 5.4% |
| Maximum | 75.2% | 54.2% |
| Range | 67.8% | 48.7% |
| Mean | 34.6% | 26.0% |
| Median | 29.9% | 22.8% |
| Interquartile 25% (IQ1) | 23.8% | 19.8% |
| Interquartile 75% (IQ3) | 47.1% | 29.2% |
| Interquartile Range (IQR) | 23.3% | 9.4% |
| Standard Deviation (Sample) | 16.0% | 11.8% |
| Standard Deviation (Population) | 15.7% | 11.6% |
Similar Demographics by Single Female Poverty
Demographics Similar to Comanche by Single Female Poverty
In terms of single female poverty, the demographic groups most similar to Comanche are Paiute (25.5%, a difference of 0.11%), Immigrants from Honduras (25.5%, a difference of 0.16%), Cherokee (25.7%, a difference of 0.36%), Central American Indian (25.5%, a difference of 0.44%), and Dominican (25.4%, a difference of 0.59%).
| Demographics | Rating | Rank | Single Female Poverty |
| Immigrants | Mexico | 0.0 /100 | #306 | Tragic 25.3% |
| Potawatomi | 0.0 /100 | #307 | Tragic 25.4% |
| Aleuts | 0.0 /100 | #308 | Tragic 25.4% |
| Dominicans | 0.0 /100 | #309 | Tragic 25.4% |
| Central American Indians | 0.0 /100 | #310 | Tragic 25.5% |
| Immigrants | Honduras | 0.0 /100 | #311 | Tragic 25.5% |
| Paiute | 0.0 /100 | #312 | Tragic 25.5% |
| Comanche | 0.0 /100 | #313 | Tragic 25.6% |
| Cherokee | 0.0 /100 | #314 | Tragic 25.7% |
| Iroquois | 0.0 /100 | #315 | Tragic 25.7% |
| Immigrants | Somalia | 0.0 /100 | #316 | Tragic 25.8% |
| Ottawa | 0.0 /100 | #317 | Tragic 26.0% |
| Chickasaw | 0.0 /100 | #318 | Tragic 26.3% |
| Blacks/African Americans | 0.0 /100 | #319 | Tragic 26.4% |
| Arapaho | 0.0 /100 | #320 | Tragic 26.4% |
Demographics Similar to Immigrants from Micronesia by Single Female Poverty
In terms of single female poverty, the demographic groups most similar to Immigrants from Micronesia are Senegalese (23.0%, a difference of 0.060%), Fijian (23.1%, a difference of 0.13%), Hmong (23.1%, a difference of 0.16%), Central American (23.0%, a difference of 0.21%), and Immigrants from Laos (22.9%, a difference of 0.38%).
| Demographics | Rating | Rank | Single Female Poverty |
| Whites/Caucasians | 0.6 /100 | #259 | Tragic 22.7% |
| Celtics | 0.5 /100 | #260 | Tragic 22.7% |
| Immigrants | Cabo Verde | 0.4 /100 | #261 | Tragic 22.8% |
| British West Indians | 0.4 /100 | #262 | Tragic 22.8% |
| Scotch-Irish | 0.3 /100 | #263 | Tragic 22.9% |
| Immigrants | Laos | 0.3 /100 | #264 | Tragic 22.9% |
| Central Americans | 0.2 /100 | #265 | Tragic 23.0% |
| Immigrants | Micronesia | 0.2 /100 | #266 | Tragic 23.0% |
| Senegalese | 0.2 /100 | #267 | Tragic 23.0% |
| Fijians | 0.2 /100 | #268 | Tragic 23.1% |
| Hmong | 0.2 /100 | #269 | Tragic 23.1% |
| Inupiat | 0.2 /100 | #270 | Tragic 23.1% |
| Sub-Saharan Africans | 0.1 /100 | #271 | Tragic 23.2% |
| Immigrants | Senegal | 0.1 /100 | #272 | Tragic 23.2% |
| Alaska Natives | 0.1 /100 | #273 | Tragic 23.3% |