Seminole vs Immigrants from Oceania Single Female Poverty
COMPARE
Seminole
Immigrants from Oceania
Single Female Poverty
Single Female Poverty Comparison
Seminole
Immigrants from Oceania
26.8%
SINGLE FEMALE POVERTY
0.0/ 100
METRIC RATING
322nd/ 347
METRIC RANK
20.7%
SINGLE FEMALE POVERTY
74.3/ 100
METRIC RATING
157th/ 347
METRIC RANK
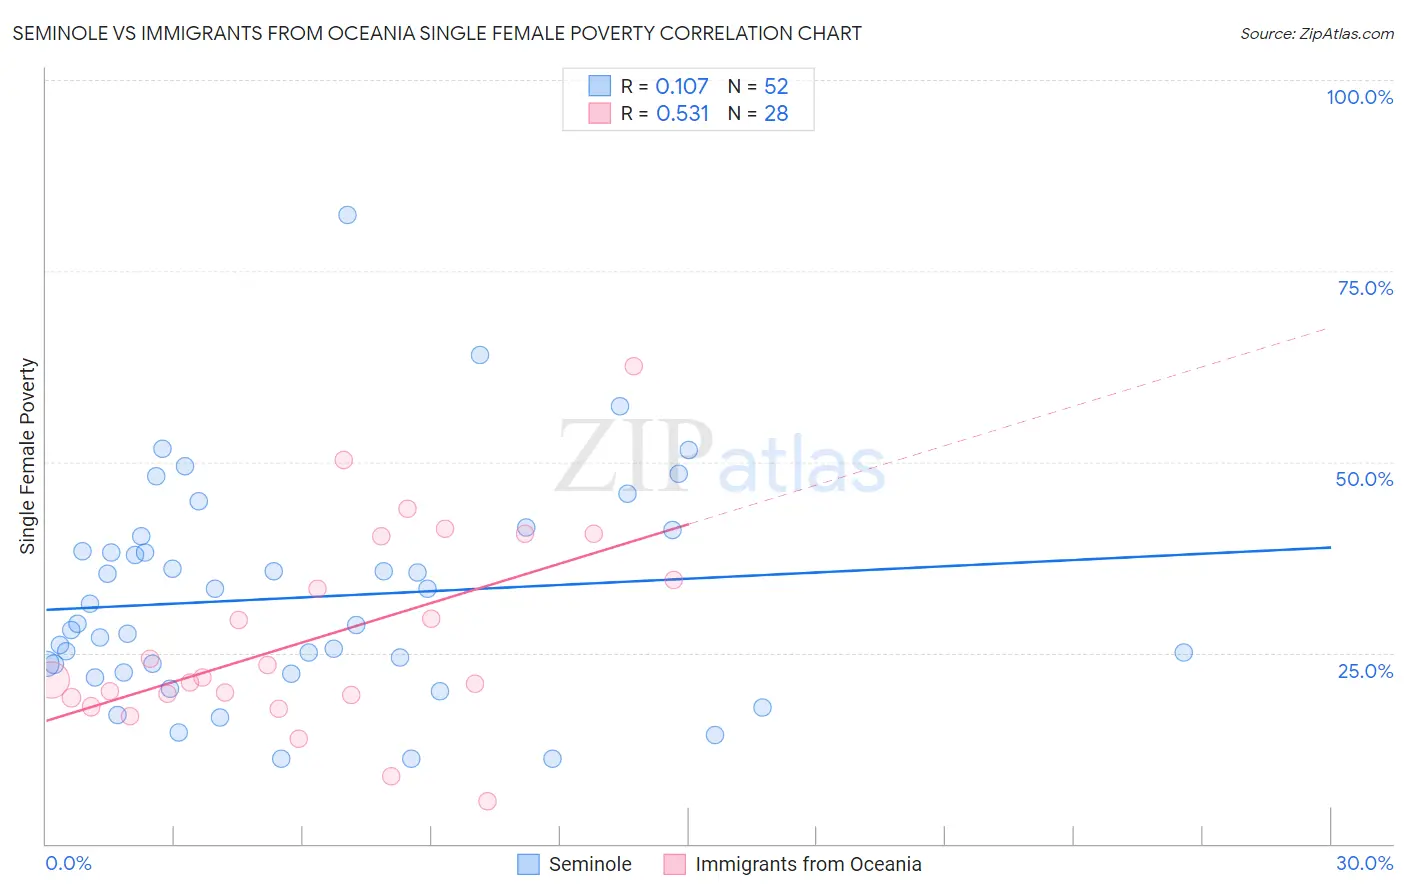
Seminole vs Immigrants from Oceania Single Female Poverty Correlation Chart
The statistical analysis conducted on geographies consisting of 117,983,009 people shows a poor positive correlation between the proportion of Seminole and poverty level among single females in the United States with a correlation coefficient (R) of 0.107 and weighted average of 26.8%. Similarly, the statistical analysis conducted on geographies consisting of 301,448,754 people shows a substantial positive correlation between the proportion of Immigrants from Oceania and poverty level among single females in the United States with a correlation coefficient (R) of 0.531 and weighted average of 20.7%, a difference of 29.7%.
Single Female Poverty Correlation Summary
| Measurement | Seminole | Immigrants from Oceania |
| Minimum | 11.1% | 5.6% |
| Maximum | 82.4% | 62.5% |
| Range | 71.2% | 56.9% |
| Mean | 32.3% | 27.0% |
| Median | 28.7% | 21.6% |
| Interquartile 25% (IQ1) | 23.0% | 19.3% |
| Interquartile 75% (IQ3) | 39.2% | 37.4% |
| Interquartile Range (IQR) | 16.2% | 18.1% |
| Standard Deviation (Sample) | 14.2% | 13.1% |
| Standard Deviation (Population) | 14.1% | 12.8% |
Similar Demographics by Single Female Poverty
Demographics Similar to Seminole by Single Female Poverty
In terms of single female poverty, the demographic groups most similar to Seminole are Chippewa (26.8%, a difference of 0.10%), Kiowa (26.9%, a difference of 0.52%), Yup'ik (26.6%, a difference of 0.74%), Arapaho (26.4%, a difference of 1.4%), and Choctaw (27.2%, a difference of 1.5%).
| Demographics | Rating | Rank | Single Female Poverty |
| Iroquois | 0.0 /100 | #315 | Tragic 25.7% |
| Immigrants | Somalia | 0.0 /100 | #316 | Tragic 25.8% |
| Ottawa | 0.0 /100 | #317 | Tragic 26.0% |
| Chickasaw | 0.0 /100 | #318 | Tragic 26.3% |
| Blacks/African Americans | 0.0 /100 | #319 | Tragic 26.4% |
| Arapaho | 0.0 /100 | #320 | Tragic 26.4% |
| Yup'ik | 0.0 /100 | #321 | Tragic 26.6% |
| Seminole | 0.0 /100 | #322 | Tragic 26.8% |
| Chippewa | 0.0 /100 | #323 | Tragic 26.8% |
| Kiowa | 0.0 /100 | #324 | Tragic 26.9% |
| Choctaw | 0.0 /100 | #325 | Tragic 27.2% |
| Creek | 0.0 /100 | #326 | Tragic 27.4% |
| Dutch West Indians | 0.0 /100 | #327 | Tragic 27.5% |
| Apache | 0.0 /100 | #328 | Tragic 27.7% |
| Menominee | 0.0 /100 | #329 | Tragic 27.8% |
Demographics Similar to Immigrants from Oceania by Single Female Poverty
In terms of single female poverty, the demographic groups most similar to Immigrants from Oceania are Danish (20.7%, a difference of 0.11%), South American Indian (20.6%, a difference of 0.12%), Samoan (20.6%, a difference of 0.15%), Costa Rican (20.7%, a difference of 0.20%), and Immigrants from Western Europe (20.6%, a difference of 0.21%).
| Demographics | Rating | Rank | Single Female Poverty |
| Immigrants | Denmark | 80.5 /100 | #150 | Excellent 20.5% |
| Puget Sound Salish | 79.6 /100 | #151 | Good 20.6% |
| Immigrants | Uruguay | 77.7 /100 | #152 | Good 20.6% |
| Swedes | 77.1 /100 | #153 | Good 20.6% |
| Immigrants | Western Europe | 76.7 /100 | #154 | Good 20.6% |
| Samoans | 76.0 /100 | #155 | Good 20.6% |
| South American Indians | 75.7 /100 | #156 | Good 20.6% |
| Immigrants | Oceania | 74.3 /100 | #157 | Good 20.7% |
| Danes | 73.0 /100 | #158 | Good 20.7% |
| Costa Ricans | 71.8 /100 | #159 | Good 20.7% |
| Arabs | 70.8 /100 | #160 | Good 20.7% |
| Kenyans | 68.5 /100 | #161 | Good 20.8% |
| Northern Europeans | 68.4 /100 | #162 | Good 20.8% |
| Lebanese | 67.6 /100 | #163 | Good 20.8% |
| Iraqis | 64.5 /100 | #164 | Good 20.8% |