Comanche vs Portuguese Single Female Poverty
COMPARE
Comanche
Portuguese
Single Female Poverty
Single Female Poverty Comparison
Comanche
Portuguese
25.6%
SINGLE FEMALE POVERTY
0.0/ 100
METRIC RATING
313th/ 347
METRIC RANK
20.5%
SINGLE FEMALE POVERTY
81.5/ 100
METRIC RATING
149th/ 347
METRIC RANK
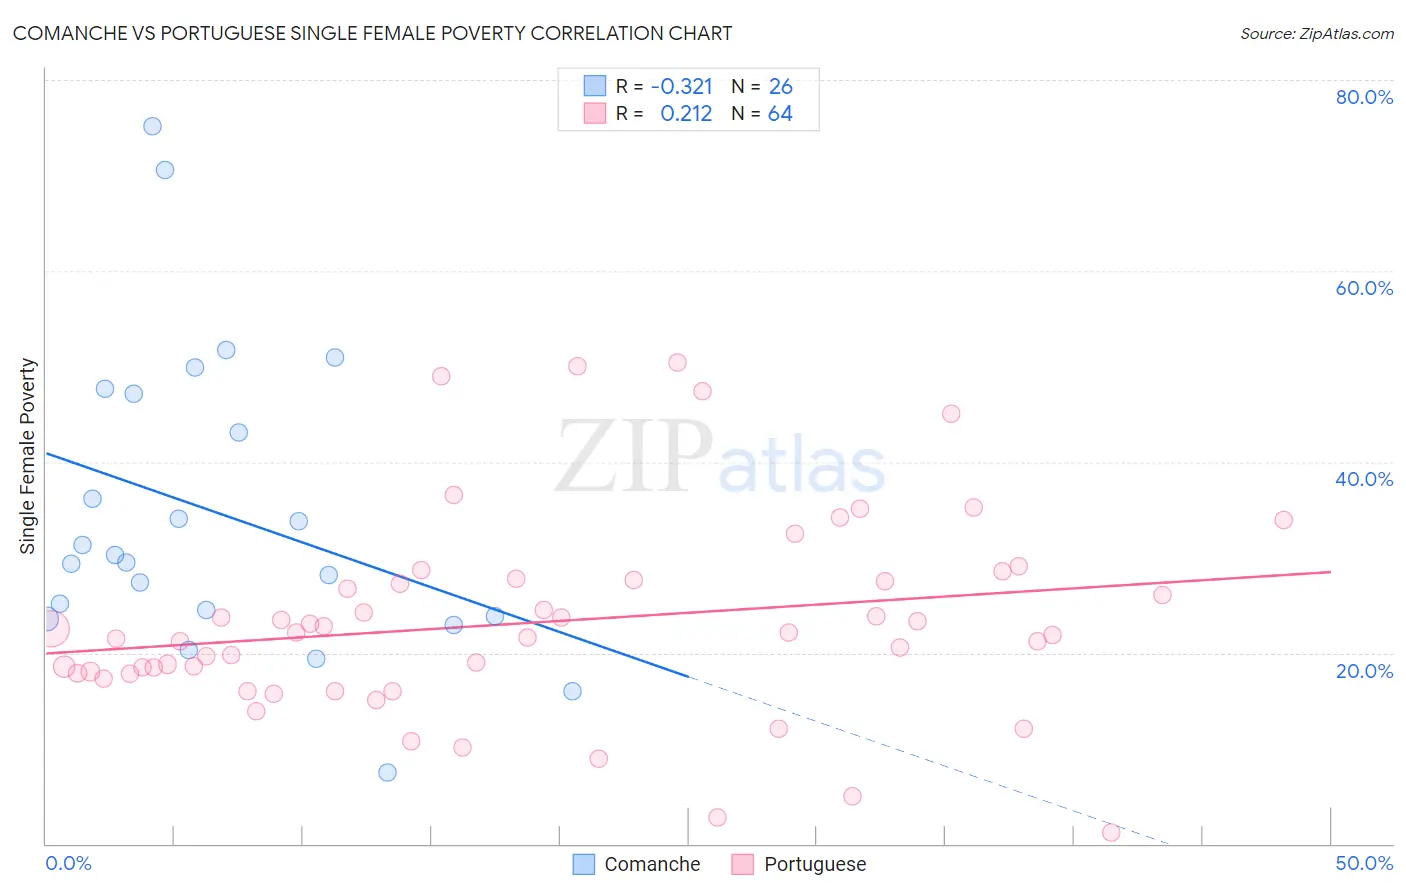
Comanche vs Portuguese Single Female Poverty Correlation Chart
The statistical analysis conducted on geographies consisting of 109,354,794 people shows a mild negative correlation between the proportion of Comanche and poverty level among single females in the United States with a correlation coefficient (R) of -0.321 and weighted average of 25.6%. Similarly, the statistical analysis conducted on geographies consisting of 440,230,754 people shows a weak positive correlation between the proportion of Portuguese and poverty level among single females in the United States with a correlation coefficient (R) of 0.212 and weighted average of 20.5%, a difference of 24.6%.
Single Female Poverty Correlation Summary
| Measurement | Comanche | Portuguese |
| Minimum | 7.4% | 1.2% |
| Maximum | 75.2% | 50.5% |
| Range | 67.8% | 49.2% |
| Mean | 34.6% | 23.2% |
| Median | 29.9% | 22.0% |
| Interquartile 25% (IQ1) | 23.8% | 17.8% |
| Interquartile 75% (IQ3) | 47.1% | 27.5% |
| Interquartile Range (IQR) | 23.3% | 9.7% |
| Standard Deviation (Sample) | 16.0% | 10.4% |
| Standard Deviation (Population) | 15.7% | 10.3% |
Similar Demographics by Single Female Poverty
Demographics Similar to Comanche by Single Female Poverty
In terms of single female poverty, the demographic groups most similar to Comanche are Paiute (25.5%, a difference of 0.11%), Immigrants from Honduras (25.5%, a difference of 0.16%), Cherokee (25.7%, a difference of 0.36%), Central American Indian (25.5%, a difference of 0.44%), and Dominican (25.4%, a difference of 0.59%).
| Demographics | Rating | Rank | Single Female Poverty |
| Immigrants | Mexico | 0.0 /100 | #306 | Tragic 25.3% |
| Potawatomi | 0.0 /100 | #307 | Tragic 25.4% |
| Aleuts | 0.0 /100 | #308 | Tragic 25.4% |
| Dominicans | 0.0 /100 | #309 | Tragic 25.4% |
| Central American Indians | 0.0 /100 | #310 | Tragic 25.5% |
| Immigrants | Honduras | 0.0 /100 | #311 | Tragic 25.5% |
| Paiute | 0.0 /100 | #312 | Tragic 25.5% |
| Comanche | 0.0 /100 | #313 | Tragic 25.6% |
| Cherokee | 0.0 /100 | #314 | Tragic 25.7% |
| Iroquois | 0.0 /100 | #315 | Tragic 25.7% |
| Immigrants | Somalia | 0.0 /100 | #316 | Tragic 25.8% |
| Ottawa | 0.0 /100 | #317 | Tragic 26.0% |
| Chickasaw | 0.0 /100 | #318 | Tragic 26.3% |
| Blacks/African Americans | 0.0 /100 | #319 | Tragic 26.4% |
| Arapaho | 0.0 /100 | #320 | Tragic 26.4% |
Demographics Similar to Portuguese by Single Female Poverty
In terms of single female poverty, the demographic groups most similar to Portuguese are Immigrants from Denmark (20.5%, a difference of 0.10%), Puget Sound Salish (20.6%, a difference of 0.19%), Immigrants from Uruguay (20.6%, a difference of 0.38%), Luxembourger (20.4%, a difference of 0.39%), and Swedish (20.6%, a difference of 0.43%).
| Demographics | Rating | Rank | Single Female Poverty |
| Immigrants | Uganda | 89.1 /100 | #142 | Excellent 20.3% |
| Australians | 88.4 /100 | #143 | Excellent 20.3% |
| Immigrants | Uzbekistan | 88.3 /100 | #144 | Excellent 20.3% |
| Austrians | 85.8 /100 | #145 | Excellent 20.4% |
| Venezuelans | 85.5 /100 | #146 | Excellent 20.4% |
| South Africans | 85.3 /100 | #147 | Excellent 20.4% |
| Luxembourgers | 84.9 /100 | #148 | Excellent 20.4% |
| Portuguese | 81.5 /100 | #149 | Excellent 20.5% |
| Immigrants | Denmark | 80.5 /100 | #150 | Excellent 20.5% |
| Puget Sound Salish | 79.6 /100 | #151 | Good 20.6% |
| Immigrants | Uruguay | 77.7 /100 | #152 | Good 20.6% |
| Swedes | 77.1 /100 | #153 | Good 20.6% |
| Immigrants | Western Europe | 76.7 /100 | #154 | Good 20.6% |
| Samoans | 76.0 /100 | #155 | Good 20.6% |
| South American Indians | 75.7 /100 | #156 | Good 20.6% |