Comanche vs Immigrants from Eritrea Single Female Poverty
COMPARE
Comanche
Immigrants from Eritrea
Single Female Poverty
Single Female Poverty Comparison
Comanche
Immigrants from Eritrea
25.6%
SINGLE FEMALE POVERTY
0.0/ 100
METRIC RATING
313th/ 347
METRIC RANK
21.8%
SINGLE FEMALE POVERTY
7.9/ 100
METRIC RATING
222nd/ 347
METRIC RANK
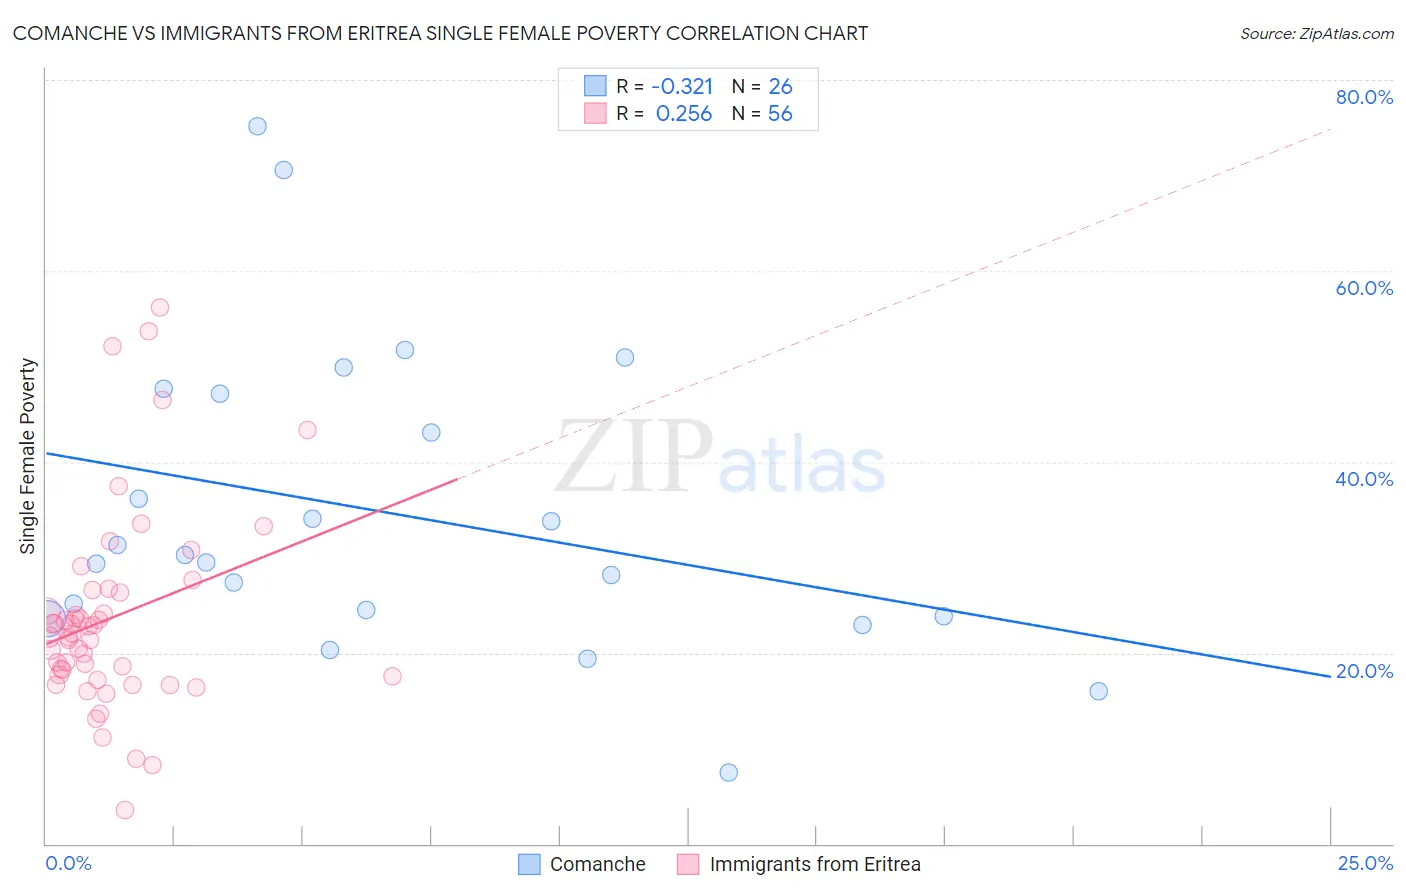
Comanche vs Immigrants from Eritrea Single Female Poverty Correlation Chart
The statistical analysis conducted on geographies consisting of 109,354,794 people shows a mild negative correlation between the proportion of Comanche and poverty level among single females in the United States with a correlation coefficient (R) of -0.321 and weighted average of 25.6%. Similarly, the statistical analysis conducted on geographies consisting of 104,658,207 people shows a weak positive correlation between the proportion of Immigrants from Eritrea and poverty level among single females in the United States with a correlation coefficient (R) of 0.256 and weighted average of 21.8%, a difference of 17.2%.
Single Female Poverty Correlation Summary
| Measurement | Comanche | Immigrants from Eritrea |
| Minimum | 7.4% | 3.5% |
| Maximum | 75.2% | 56.2% |
| Range | 67.8% | 52.6% |
| Mean | 34.6% | 23.7% |
| Median | 29.9% | 21.8% |
| Interquartile 25% (IQ1) | 23.8% | 17.6% |
| Interquartile 75% (IQ3) | 47.1% | 26.4% |
| Interquartile Range (IQR) | 23.3% | 8.8% |
| Standard Deviation (Sample) | 16.0% | 10.5% |
| Standard Deviation (Population) | 15.7% | 10.4% |
Similar Demographics by Single Female Poverty
Demographics Similar to Comanche by Single Female Poverty
In terms of single female poverty, the demographic groups most similar to Comanche are Paiute (25.5%, a difference of 0.11%), Immigrants from Honduras (25.5%, a difference of 0.16%), Cherokee (25.7%, a difference of 0.36%), Central American Indian (25.5%, a difference of 0.44%), and Dominican (25.4%, a difference of 0.59%).
| Demographics | Rating | Rank | Single Female Poverty |
| Immigrants | Mexico | 0.0 /100 | #306 | Tragic 25.3% |
| Potawatomi | 0.0 /100 | #307 | Tragic 25.4% |
| Aleuts | 0.0 /100 | #308 | Tragic 25.4% |
| Dominicans | 0.0 /100 | #309 | Tragic 25.4% |
| Central American Indians | 0.0 /100 | #310 | Tragic 25.5% |
| Immigrants | Honduras | 0.0 /100 | #311 | Tragic 25.5% |
| Paiute | 0.0 /100 | #312 | Tragic 25.5% |
| Comanche | 0.0 /100 | #313 | Tragic 25.6% |
| Cherokee | 0.0 /100 | #314 | Tragic 25.7% |
| Iroquois | 0.0 /100 | #315 | Tragic 25.7% |
| Immigrants | Somalia | 0.0 /100 | #316 | Tragic 25.8% |
| Ottawa | 0.0 /100 | #317 | Tragic 26.0% |
| Chickasaw | 0.0 /100 | #318 | Tragic 26.3% |
| Blacks/African Americans | 0.0 /100 | #319 | Tragic 26.4% |
| Arapaho | 0.0 /100 | #320 | Tragic 26.4% |
Demographics Similar to Immigrants from Eritrea by Single Female Poverty
In terms of single female poverty, the demographic groups most similar to Immigrants from Eritrea are Immigrants from Grenada (21.8%, a difference of 0.010%), German (21.8%, a difference of 0.070%), Scottish (21.8%, a difference of 0.14%), Barbadian (21.8%, a difference of 0.16%), and Panamanian (21.7%, a difference of 0.27%).
| Demographics | Rating | Rank | Single Female Poverty |
| Ecuadorians | 12.3 /100 | #215 | Poor 21.6% |
| Immigrants | Barbados | 12.2 /100 | #216 | Poor 21.7% |
| Immigrants | St. Vincent and the Grenadines | 11.7 /100 | #217 | Poor 21.7% |
| Nepalese | 9.7 /100 | #218 | Tragic 21.7% |
| Panamanians | 9.4 /100 | #219 | Tragic 21.7% |
| Germans | 8.3 /100 | #220 | Tragic 21.8% |
| Immigrants | Grenada | 8.0 /100 | #221 | Tragic 21.8% |
| Immigrants | Eritrea | 7.9 /100 | #222 | Tragic 21.8% |
| Scottish | 7.3 /100 | #223 | Tragic 21.8% |
| Barbadians | 7.2 /100 | #224 | Tragic 21.8% |
| English | 6.4 /100 | #225 | Tragic 21.9% |
| Immigrants | Portugal | 5.8 /100 | #226 | Tragic 21.9% |
| Immigrants | Ghana | 5.8 /100 | #227 | Tragic 21.9% |
| Salvadorans | 5.5 /100 | #228 | Tragic 21.9% |
| Tlingit-Haida | 5.4 /100 | #229 | Tragic 21.9% |