Comanche vs Immigrants from Oceania Poverty
COMPARE
Comanche
Immigrants from Oceania
Poverty
Poverty Comparison
Comanche
Immigrants from Oceania
15.0%
POVERTY
0.0/ 100
METRIC RATING
282nd/ 347
METRIC RANK
12.3%
POVERTY
54.6/ 100
METRIC RATING
170th/ 347
METRIC RANK
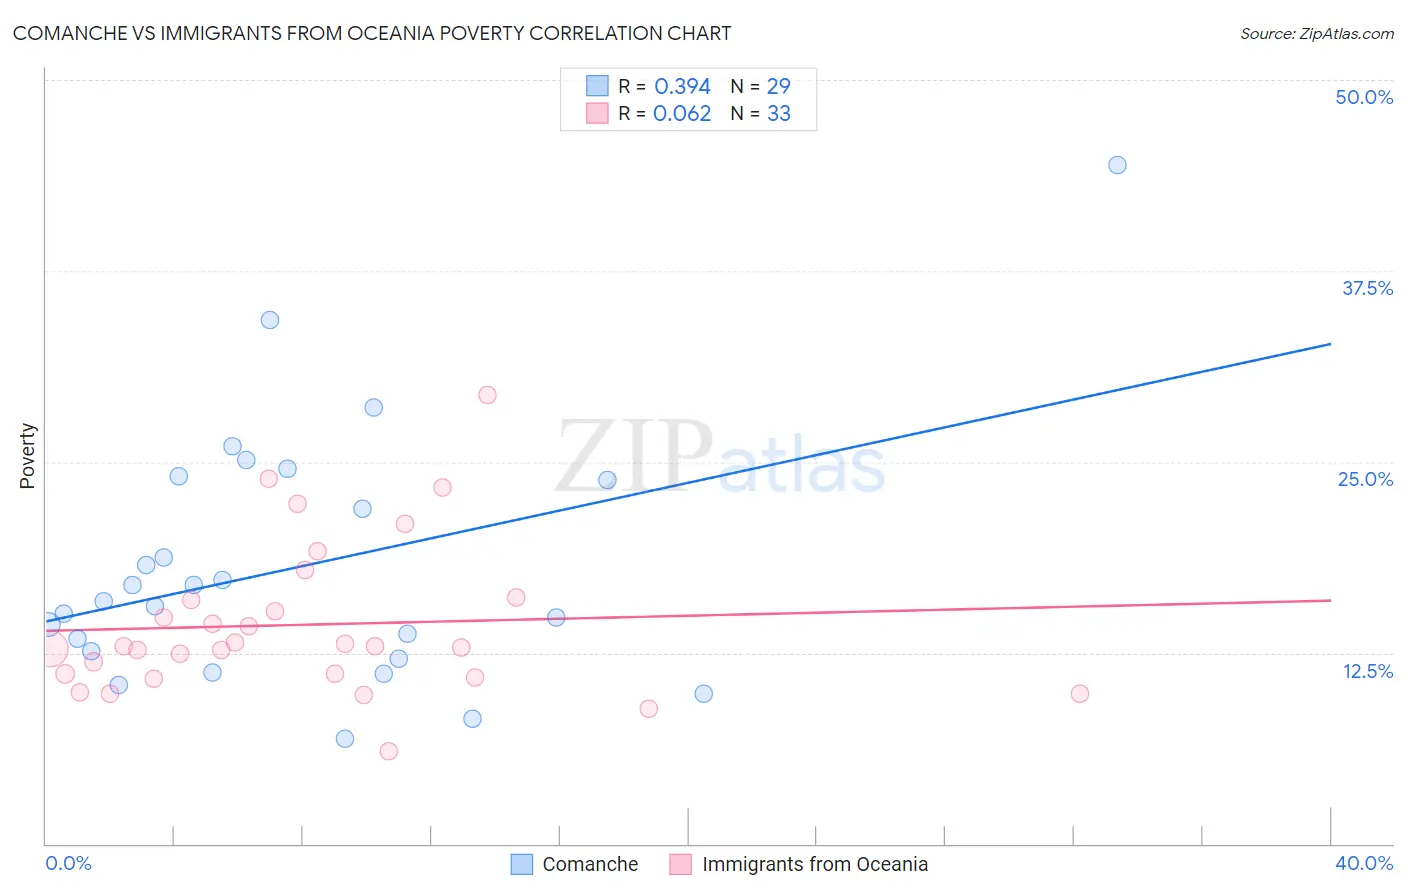
Comanche vs Immigrants from Oceania Poverty Correlation Chart
The statistical analysis conducted on geographies consisting of 109,758,867 people shows a mild positive correlation between the proportion of Comanche and poverty level in the United States with a correlation coefficient (R) of 0.394 and weighted average of 15.0%. Similarly, the statistical analysis conducted on geographies consisting of 305,386,119 people shows a slight positive correlation between the proportion of Immigrants from Oceania and poverty level in the United States with a correlation coefficient (R) of 0.062 and weighted average of 12.3%, a difference of 21.9%.
Poverty Correlation Summary
| Measurement | Comanche | Immigrants from Oceania |
| Minimum | 6.8% | 6.0% |
| Maximum | 44.4% | 29.4% |
| Range | 37.6% | 23.4% |
| Mean | 18.1% | 14.3% |
| Median | 15.9% | 12.9% |
| Interquartile 25% (IQ1) | 12.4% | 11.0% |
| Interquartile 75% (IQ3) | 24.0% | 16.1% |
| Interquartile Range (IQR) | 11.6% | 5.1% |
| Standard Deviation (Sample) | 8.3% | 5.0% |
| Standard Deviation (Population) | 8.1% | 4.9% |
Similar Demographics by Poverty
Demographics Similar to Comanche by Poverty
In terms of poverty, the demographic groups most similar to Comanche are Immigrants from Haiti (15.0%, a difference of 0.12%), West Indian (15.0%, a difference of 0.23%), Vietnamese (15.0%, a difference of 0.28%), Immigrants from Barbados (14.9%, a difference of 0.33%), and Haitian (14.9%, a difference of 0.40%).
| Demographics | Rating | Rank | Poverty |
| Immigrants | West Indies | 0.0 /100 | #275 | Tragic 14.8% |
| Immigrants | Bahamas | 0.0 /100 | #276 | Tragic 14.8% |
| Bangladeshis | 0.0 /100 | #277 | Tragic 14.8% |
| Belizeans | 0.0 /100 | #278 | Tragic 14.8% |
| Immigrants | St. Vincent and the Grenadines | 0.0 /100 | #279 | Tragic 14.9% |
| Haitians | 0.0 /100 | #280 | Tragic 14.9% |
| Immigrants | Barbados | 0.0 /100 | #281 | Tragic 14.9% |
| Comanche | 0.0 /100 | #282 | Tragic 15.0% |
| Immigrants | Haiti | 0.0 /100 | #283 | Tragic 15.0% |
| West Indians | 0.0 /100 | #284 | Tragic 15.0% |
| Vietnamese | 0.0 /100 | #285 | Tragic 15.0% |
| Immigrants | Latin America | 0.0 /100 | #286 | Tragic 15.0% |
| Inupiat | 0.0 /100 | #287 | Tragic 15.1% |
| Yaqui | 0.0 /100 | #288 | Tragic 15.1% |
| Immigrants | Belize | 0.0 /100 | #289 | Tragic 15.1% |
Demographics Similar to Immigrants from Oceania by Poverty
In terms of poverty, the demographic groups most similar to Immigrants from Oceania are White/Caucasian (12.3%, a difference of 0.080%), Immigrants from Venezuela (12.2%, a difference of 0.19%), Immigrants from Chile (12.2%, a difference of 0.21%), Venezuelan (12.2%, a difference of 0.23%), and Immigrants from Albania (12.2%, a difference of 0.31%).
| Demographics | Rating | Rank | Poverty |
| Immigrants | Ethiopia | 58.6 /100 | #163 | Average 12.2% |
| Colombians | 57.8 /100 | #164 | Average 12.2% |
| Immigrants | Albania | 57.7 /100 | #165 | Average 12.2% |
| Venezuelans | 56.9 /100 | #166 | Average 12.2% |
| Immigrants | Chile | 56.7 /100 | #167 | Average 12.2% |
| Immigrants | Venezuela | 56.5 /100 | #168 | Average 12.2% |
| Whites/Caucasians | 55.4 /100 | #169 | Average 12.3% |
| Immigrants | Oceania | 54.6 /100 | #170 | Average 12.3% |
| Immigrants | Spain | 51.3 /100 | #171 | Average 12.3% |
| Immigrants | Portugal | 50.5 /100 | #172 | Average 12.3% |
| Celtics | 50.1 /100 | #173 | Average 12.3% |
| Lebanese | 50.0 /100 | #174 | Average 12.3% |
| South Americans | 48.7 /100 | #175 | Average 12.3% |
| Immigrants | Colombia | 47.7 /100 | #176 | Average 12.3% |
| Immigrants | Syria | 47.5 /100 | #177 | Average 12.3% |