Chilean vs Immigrants from Latvia Single Male Poverty
COMPARE
Chilean
Immigrants from Latvia
Single Male Poverty
Single Male Poverty Comparison
Chileans
Immigrants from Latvia
11.9%
SINGLE MALE POVERTY
99.5/ 100
METRIC RATING
74th/ 347
METRIC RANK
12.2%
SINGLE MALE POVERTY
97.0/ 100
METRIC RATING
101st/ 347
METRIC RANK
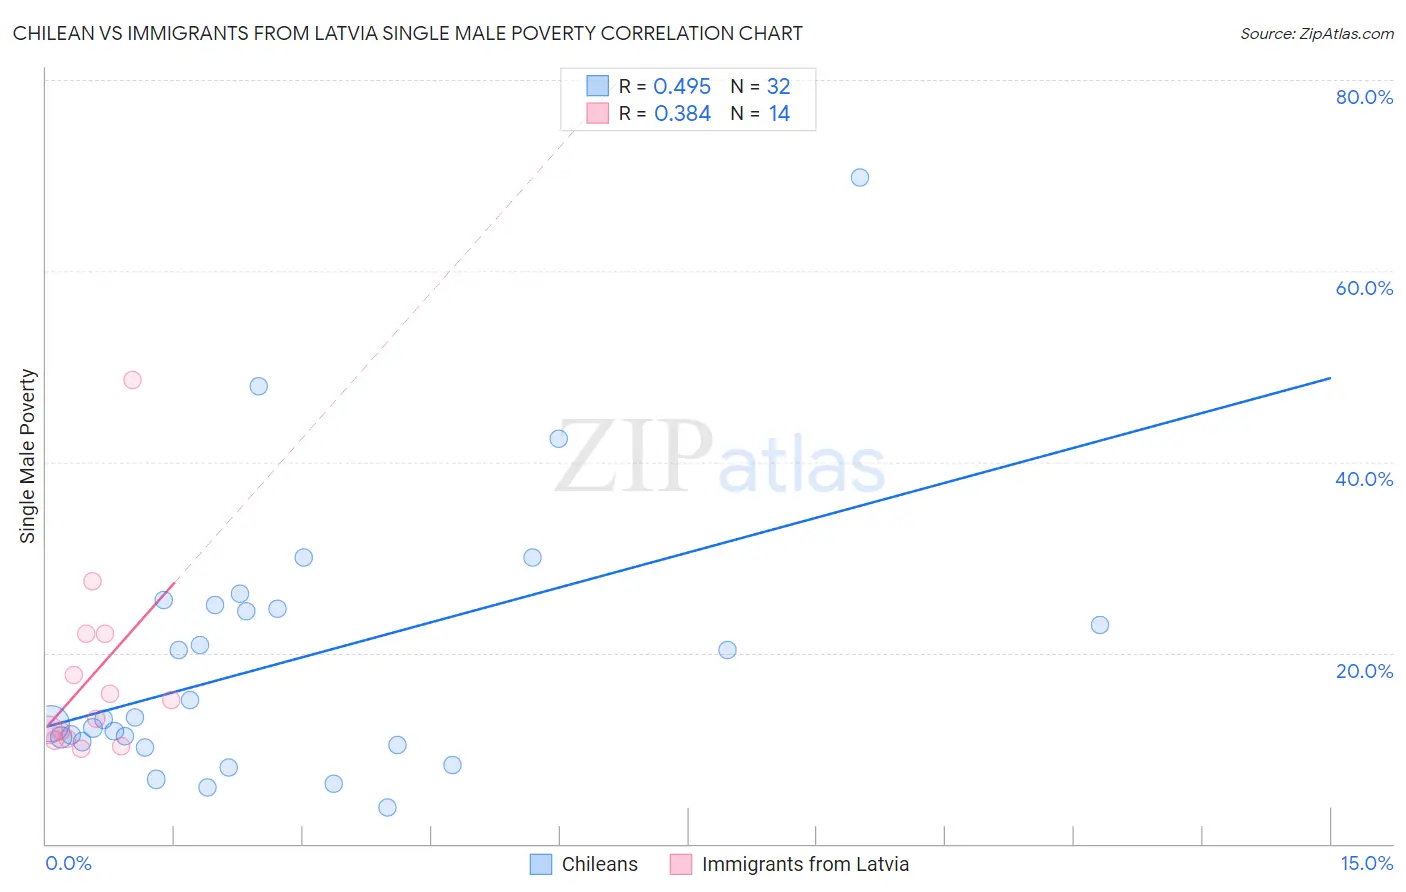
Chilean vs Immigrants from Latvia Single Male Poverty Correlation Chart
The statistical analysis conducted on geographies consisting of 235,919,497 people shows a moderate positive correlation between the proportion of Chileans and poverty level among single males in the United States with a correlation coefficient (R) of 0.495 and weighted average of 11.9%. Similarly, the statistical analysis conducted on geographies consisting of 106,119,330 people shows a mild positive correlation between the proportion of Immigrants from Latvia and poverty level among single males in the United States with a correlation coefficient (R) of 0.384 and weighted average of 12.2%, a difference of 2.4%.
Single Male Poverty Correlation Summary
| Measurement | Chilean | Immigrants from Latvia |
| Minimum | 3.8% | 9.9% |
| Maximum | 69.8% | 48.6% |
| Range | 66.0% | 38.7% |
| Mean | 19.1% | 17.7% |
| Median | 13.1% | 14.1% |
| Interquartile 25% (IQ1) | 10.5% | 11.0% |
| Interquartile 75% (IQ3) | 24.9% | 22.0% |
| Interquartile Range (IQR) | 14.3% | 11.0% |
| Standard Deviation (Sample) | 13.9% | 10.4% |
| Standard Deviation (Population) | 13.7% | 10.0% |
Similar Demographics by Single Male Poverty
Demographics Similar to Chileans by Single Male Poverty
In terms of single male poverty, the demographic groups most similar to Chileans are Argentinean (11.9%, a difference of 0.060%), Immigrants from Argentina (11.9%, a difference of 0.18%), Uruguayan (11.9%, a difference of 0.19%), Immigrants from Northern Africa (11.9%, a difference of 0.22%), and Immigrants from Greece (11.9%, a difference of 0.36%).
| Demographics | Rating | Rank | Single Male Poverty |
| Immigrants | Ukraine | 99.6 /100 | #67 | Exceptional 11.9% |
| Immigrants | Croatia | 99.6 /100 | #68 | Exceptional 11.9% |
| Immigrants | Russia | 99.6 /100 | #69 | Exceptional 11.9% |
| Immigrants | Nepal | 99.6 /100 | #70 | Exceptional 11.9% |
| Immigrants | Greece | 99.6 /100 | #71 | Exceptional 11.9% |
| Immigrants | Argentina | 99.5 /100 | #72 | Exceptional 11.9% |
| Argentineans | 99.5 /100 | #73 | Exceptional 11.9% |
| Chileans | 99.5 /100 | #74 | Exceptional 11.9% |
| Uruguayans | 99.4 /100 | #75 | Exceptional 11.9% |
| Immigrants | Northern Africa | 99.4 /100 | #76 | Exceptional 11.9% |
| Immigrants | Malaysia | 99.2 /100 | #77 | Exceptional 12.0% |
| Immigrants | Venezuela | 99.1 /100 | #78 | Exceptional 12.0% |
| Immigrants | Belgium | 99.0 /100 | #79 | Exceptional 12.0% |
| Armenians | 98.7 /100 | #80 | Exceptional 12.1% |
| Immigrants | South America | 98.7 /100 | #81 | Exceptional 12.1% |
Demographics Similar to Immigrants from Latvia by Single Male Poverty
In terms of single male poverty, the demographic groups most similar to Immigrants from Latvia are Immigrants from Europe (12.2%, a difference of 0.010%), Immigrants from Australia (12.2%, a difference of 0.030%), Immigrants from Cuba (12.2%, a difference of 0.15%), Immigrants from Armenia (12.2%, a difference of 0.15%), and Immigrants from Kazakhstan (12.2%, a difference of 0.15%).
| Demographics | Rating | Rank | Single Male Poverty |
| Colombians | 97.8 /100 | #94 | Exceptional 12.2% |
| Mongolians | 97.7 /100 | #95 | Exceptional 12.2% |
| Immigrants | Sweden | 97.5 /100 | #96 | Exceptional 12.2% |
| Immigrants | Italy | 97.4 /100 | #97 | Exceptional 12.2% |
| Guamanians/Chamorros | 97.4 /100 | #98 | Exceptional 12.2% |
| Immigrants | Cuba | 97.3 /100 | #99 | Exceptional 12.2% |
| Immigrants | Australia | 97.1 /100 | #100 | Exceptional 12.2% |
| Immigrants | Latvia | 97.0 /100 | #101 | Exceptional 12.2% |
| Immigrants | Europe | 97.0 /100 | #102 | Exceptional 12.2% |
| Immigrants | Armenia | 96.7 /100 | #103 | Exceptional 12.2% |
| Immigrants | Kazakhstan | 96.7 /100 | #104 | Exceptional 12.2% |
| Jordanians | 95.9 /100 | #105 | Exceptional 12.3% |
| Immigrants | Morocco | 95.6 /100 | #106 | Exceptional 12.3% |
| Iraqis | 95.1 /100 | #107 | Exceptional 12.3% |
| Immigrants | Eastern Africa | 95.0 /100 | #108 | Exceptional 12.3% |