Chilean vs Immigrants from Hungary Single Male Poverty
COMPARE
Chilean
Immigrants from Hungary
Single Male Poverty
Single Male Poverty Comparison
Chileans
Immigrants from Hungary
11.9%
SINGLE MALE POVERTY
99.5/ 100
METRIC RATING
74th/ 347
METRIC RANK
12.6%
SINGLE MALE POVERTY
71.9/ 100
METRIC RATING
151st/ 347
METRIC RANK
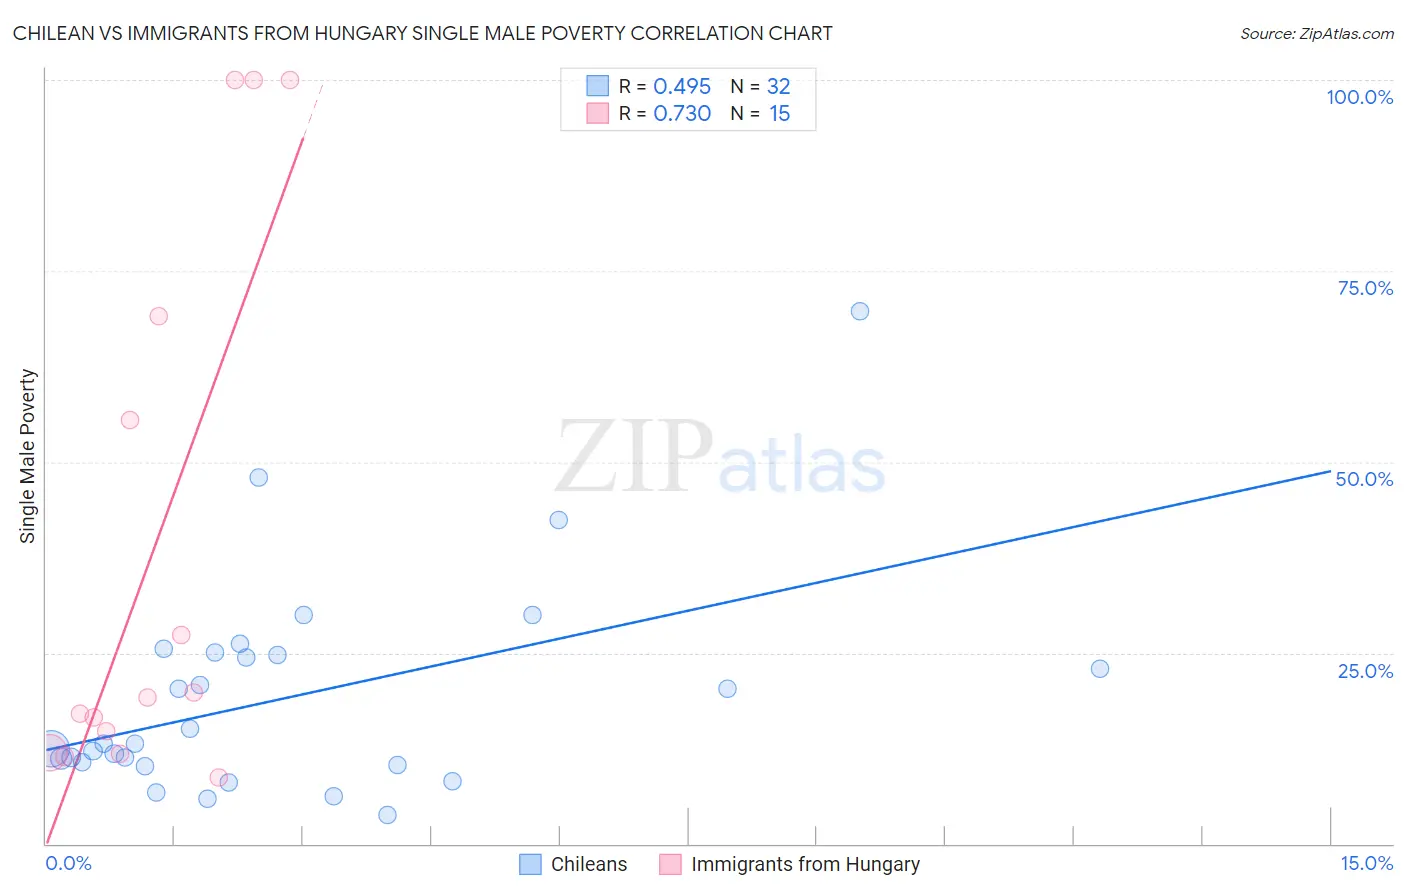
Chilean vs Immigrants from Hungary Single Male Poverty Correlation Chart
The statistical analysis conducted on geographies consisting of 235,919,497 people shows a moderate positive correlation between the proportion of Chileans and poverty level among single males in the United States with a correlation coefficient (R) of 0.495 and weighted average of 11.9%. Similarly, the statistical analysis conducted on geographies consisting of 178,525,850 people shows a strong positive correlation between the proportion of Immigrants from Hungary and poverty level among single males in the United States with a correlation coefficient (R) of 0.730 and weighted average of 12.6%, a difference of 6.0%.
Single Male Poverty Correlation Summary
| Measurement | Chilean | Immigrants from Hungary |
| Minimum | 3.8% | 8.7% |
| Maximum | 69.8% | 100.0% |
| Range | 66.0% | 91.3% |
| Mean | 19.1% | 38.9% |
| Median | 13.1% | 19.1% |
| Interquartile 25% (IQ1) | 10.5% | 11.9% |
| Interquartile 75% (IQ3) | 24.9% | 69.1% |
| Interquartile Range (IQR) | 14.3% | 57.2% |
| Standard Deviation (Sample) | 13.9% | 35.8% |
| Standard Deviation (Population) | 13.7% | 34.6% |
Similar Demographics by Single Male Poverty
Demographics Similar to Chileans by Single Male Poverty
In terms of single male poverty, the demographic groups most similar to Chileans are Argentinean (11.9%, a difference of 0.060%), Immigrants from Argentina (11.9%, a difference of 0.18%), Uruguayan (11.9%, a difference of 0.19%), Immigrants from Northern Africa (11.9%, a difference of 0.22%), and Immigrants from Greece (11.9%, a difference of 0.36%).
| Demographics | Rating | Rank | Single Male Poverty |
| Immigrants | Ukraine | 99.6 /100 | #67 | Exceptional 11.9% |
| Immigrants | Croatia | 99.6 /100 | #68 | Exceptional 11.9% |
| Immigrants | Russia | 99.6 /100 | #69 | Exceptional 11.9% |
| Immigrants | Nepal | 99.6 /100 | #70 | Exceptional 11.9% |
| Immigrants | Greece | 99.6 /100 | #71 | Exceptional 11.9% |
| Immigrants | Argentina | 99.5 /100 | #72 | Exceptional 11.9% |
| Argentineans | 99.5 /100 | #73 | Exceptional 11.9% |
| Chileans | 99.5 /100 | #74 | Exceptional 11.9% |
| Uruguayans | 99.4 /100 | #75 | Exceptional 11.9% |
| Immigrants | Northern Africa | 99.4 /100 | #76 | Exceptional 11.9% |
| Immigrants | Malaysia | 99.2 /100 | #77 | Exceptional 12.0% |
| Immigrants | Venezuela | 99.1 /100 | #78 | Exceptional 12.0% |
| Immigrants | Belgium | 99.0 /100 | #79 | Exceptional 12.0% |
| Armenians | 98.7 /100 | #80 | Exceptional 12.1% |
| Immigrants | South America | 98.7 /100 | #81 | Exceptional 12.1% |
Demographics Similar to Immigrants from Hungary by Single Male Poverty
In terms of single male poverty, the demographic groups most similar to Immigrants from Hungary are Immigrants from Panama (12.6%, a difference of 0.010%), Australian (12.6%, a difference of 0.030%), Sierra Leonean (12.6%, a difference of 0.070%), Immigrants (12.7%, a difference of 0.12%), and Yugoslavian (12.6%, a difference of 0.14%).
| Demographics | Rating | Rank | Single Male Poverty |
| Hawaiians | 75.1 /100 | #144 | Good 12.6% |
| Immigrants | Lebanon | 75.0 /100 | #145 | Good 12.6% |
| Native Hawaiians | 75.0 /100 | #146 | Good 12.6% |
| Malaysians | 74.8 /100 | #147 | Good 12.6% |
| Yugoslavians | 73.9 /100 | #148 | Good 12.6% |
| Sierra Leoneans | 73.0 /100 | #149 | Good 12.6% |
| Immigrants | Panama | 72.1 /100 | #150 | Good 12.6% |
| Immigrants | Hungary | 71.9 /100 | #151 | Good 12.6% |
| Australians | 71.4 /100 | #152 | Good 12.6% |
| Immigrants | Immigrants | 70.1 /100 | #153 | Good 12.7% |
| Immigrants | Scotland | 68.9 /100 | #154 | Good 12.7% |
| Immigrants | Spain | 68.7 /100 | #155 | Good 12.7% |
| Vietnamese | 67.9 /100 | #156 | Good 12.7% |
| Latvians | 67.9 /100 | #157 | Good 12.7% |
| Immigrants | Middle Africa | 64.9 /100 | #158 | Good 12.7% |