Chilean vs Apache College, 1 year or more
COMPARE
Chilean
Apache
College, 1 year or more
College, 1 year or more Comparison
Chileans
Apache
62.0%
COLLEGE, 1 YEAR OR MORE
96.4/ 100
METRIC RATING
104th/ 347
METRIC RANK
51.8%
COLLEGE, 1 YEAR OR MORE
0.0/ 100
METRIC RATING
309th/ 347
METRIC RANK
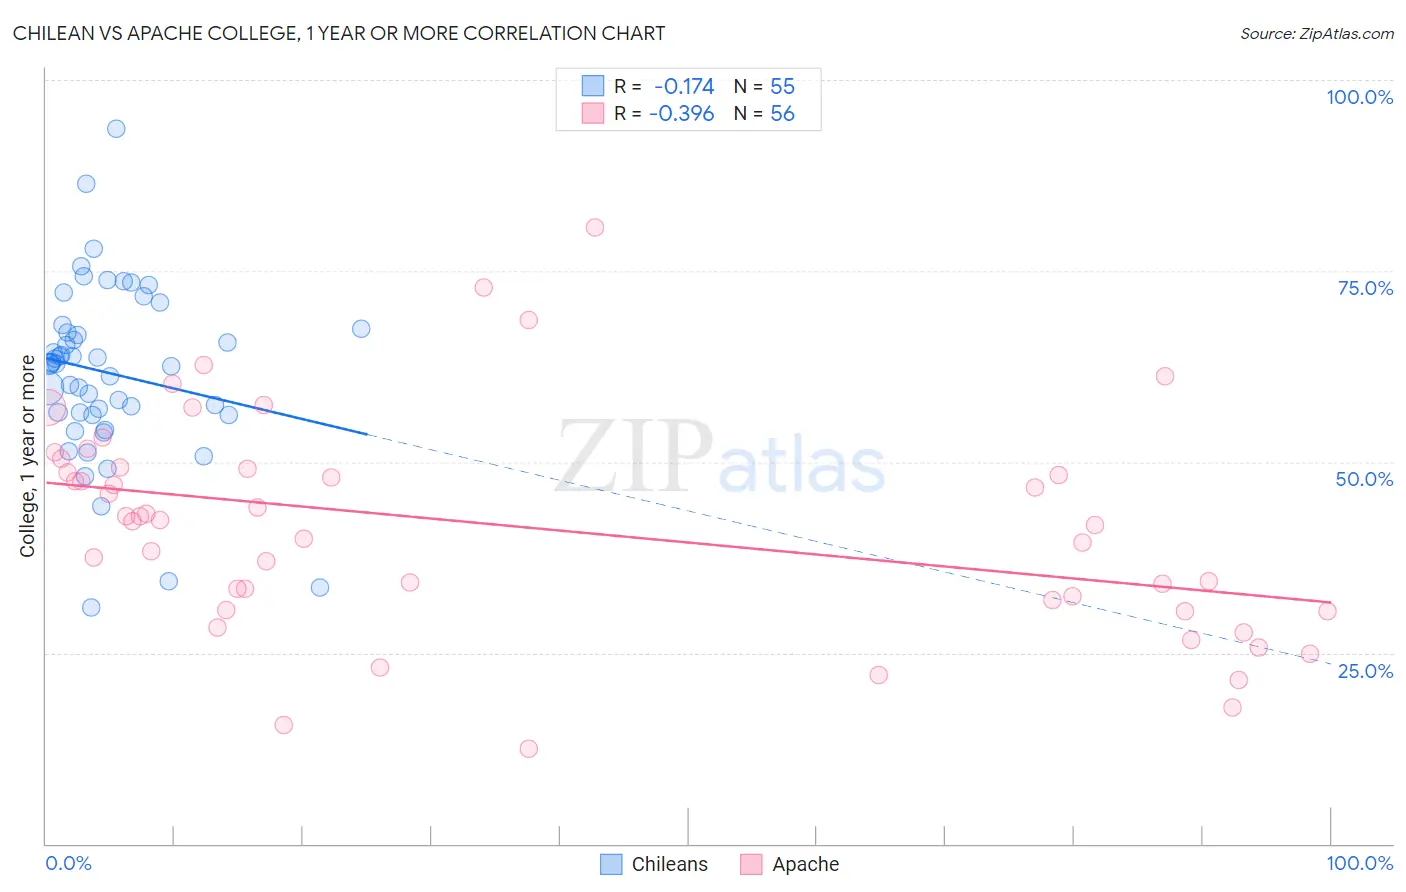
Chilean vs Apache College, 1 year or more Correlation Chart
The statistical analysis conducted on geographies consisting of 256,684,337 people shows a poor negative correlation between the proportion of Chileans and percentage of population with at least college, 1 year or more education in the United States with a correlation coefficient (R) of -0.174 and weighted average of 62.0%. Similarly, the statistical analysis conducted on geographies consisting of 231,142,948 people shows a mild negative correlation between the proportion of Apache and percentage of population with at least college, 1 year or more education in the United States with a correlation coefficient (R) of -0.396 and weighted average of 51.8%, a difference of 19.7%.
College, 1 year or more Correlation Summary
| Measurement | Chilean | Apache |
| Minimum | 30.9% | 12.5% |
| Maximum | 93.7% | 80.6% |
| Range | 62.8% | 68.1% |
| Mean | 61.6% | 41.5% |
| Median | 62.9% | 42.4% |
| Interquartile 25% (IQ1) | 56.2% | 31.2% |
| Interquartile 75% (IQ3) | 67.5% | 49.2% |
| Interquartile Range (IQR) | 11.3% | 18.0% |
| Standard Deviation (Sample) | 11.5% | 14.3% |
| Standard Deviation (Population) | 11.4% | 14.1% |
Similar Demographics by College, 1 year or more
Demographics Similar to Chileans by College, 1 year or more
In terms of college, 1 year or more, the demographic groups most similar to Chileans are Afghan (62.0%, a difference of 0.010%), Immigrants from Nepal (62.0%, a difference of 0.020%), Palestinian (62.0%, a difference of 0.020%), Luxembourger (62.1%, a difference of 0.13%), and Swedish (62.1%, a difference of 0.14%).
| Demographics | Rating | Rank | College, 1 year or more |
| Jordanians | 97.2 /100 | #97 | Exceptional 62.2% |
| Carpatho Rusyns | 97.2 /100 | #98 | Exceptional 62.2% |
| Croatians | 97.1 /100 | #99 | Exceptional 62.2% |
| Icelanders | 96.8 /100 | #100 | Exceptional 62.1% |
| Swedes | 96.8 /100 | #101 | Exceptional 62.1% |
| Luxembourgers | 96.7 /100 | #102 | Exceptional 62.1% |
| Afghans | 96.4 /100 | #103 | Exceptional 62.0% |
| Chileans | 96.4 /100 | #104 | Exceptional 62.0% |
| Immigrants | Nepal | 96.3 /100 | #105 | Exceptional 62.0% |
| Palestinians | 96.3 /100 | #106 | Exceptional 62.0% |
| Immigrants | Ukraine | 95.8 /100 | #107 | Exceptional 61.9% |
| Syrians | 95.7 /100 | #108 | Exceptional 61.9% |
| Immigrants | Northern Africa | 95.7 /100 | #109 | Exceptional 61.9% |
| Europeans | 95.6 /100 | #110 | Exceptional 61.8% |
| Macedonians | 95.6 /100 | #111 | Exceptional 61.8% |
Demographics Similar to Apache by College, 1 year or more
In terms of college, 1 year or more, the demographic groups most similar to Apache are Salvadoran (51.8%, a difference of 0.010%), Immigrants from Portugal (51.9%, a difference of 0.11%), Mexican American Indian (51.9%, a difference of 0.22%), Honduran (51.6%, a difference of 0.39%), and Seminole (52.1%, a difference of 0.55%).
| Demographics | Rating | Rank | College, 1 year or more |
| Puerto Ricans | 0.0 /100 | #302 | Tragic 52.2% |
| Creek | 0.0 /100 | #303 | Tragic 52.2% |
| Central Americans | 0.0 /100 | #304 | Tragic 52.1% |
| Seminole | 0.0 /100 | #305 | Tragic 52.1% |
| Mexican American Indians | 0.0 /100 | #306 | Tragic 51.9% |
| Immigrants | Portugal | 0.0 /100 | #307 | Tragic 51.9% |
| Salvadorans | 0.0 /100 | #308 | Tragic 51.8% |
| Apache | 0.0 /100 | #309 | Tragic 51.8% |
| Hondurans | 0.0 /100 | #310 | Tragic 51.6% |
| Immigrants | Haiti | 0.0 /100 | #311 | Tragic 51.5% |
| Pueblo | 0.0 /100 | #312 | Tragic 51.5% |
| Immigrants | Caribbean | 0.0 /100 | #313 | Tragic 51.4% |
| Fijians | 0.0 /100 | #314 | Tragic 51.3% |
| Guatemalans | 0.0 /100 | #315 | Tragic 51.2% |
| Cajuns | 0.0 /100 | #316 | Tragic 51.2% |