Chilean vs Apache 3 or more Vehicles in Household
COMPARE
Chilean
Apache
3 or more Vehicles in Household
3 or more Vehicles in Household Comparison
Chileans
Apache
19.7%
3 OR MORE VEHICLES IN HOUSEHOLD
63.0/ 100
METRIC RATING
163rd/ 347
METRIC RANK
21.2%
3 OR MORE VEHICLES IN HOUSEHOLD
98.9/ 100
METRIC RATING
92nd/ 347
METRIC RANK
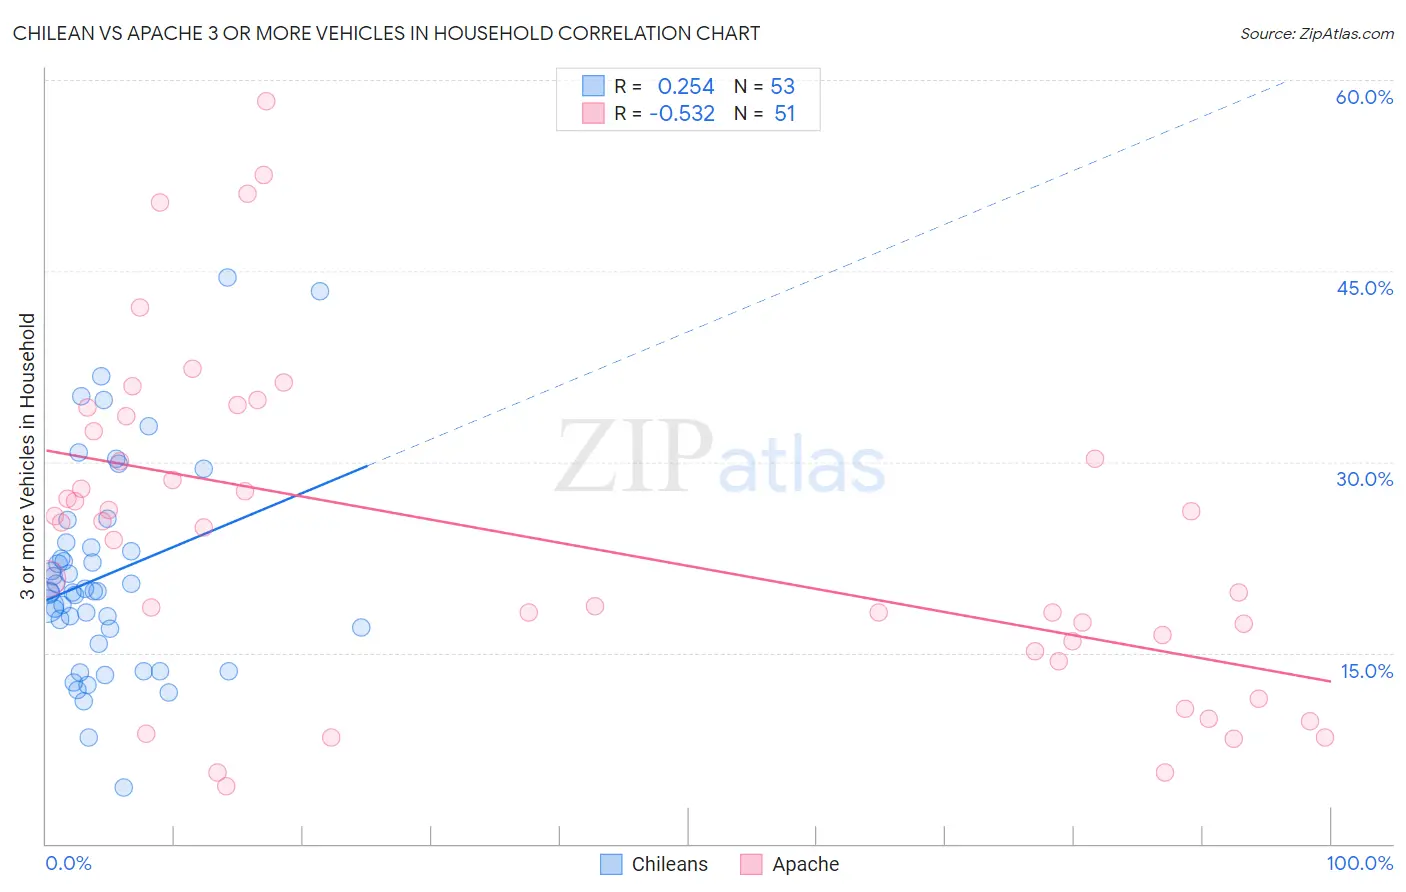
Chilean vs Apache 3 or more Vehicles in Household Correlation Chart
The statistical analysis conducted on geographies consisting of 256,506,401 people shows a weak positive correlation between the proportion of Chileans and percentage of households with 3 or more vehicles available in the United States with a correlation coefficient (R) of 0.254 and weighted average of 19.7%. Similarly, the statistical analysis conducted on geographies consisting of 231,026,513 people shows a substantial negative correlation between the proportion of Apache and percentage of households with 3 or more vehicles available in the United States with a correlation coefficient (R) of -0.532 and weighted average of 21.2%, a difference of 7.4%.
3 or more Vehicles in Household Correlation Summary
| Measurement | Chilean | Apache |
| Minimum | 4.5% | 4.5% |
| Maximum | 44.4% | 58.3% |
| Range | 40.0% | 53.9% |
| Mean | 21.1% | 24.1% |
| Median | 19.8% | 24.8% |
| Interquartile 25% (IQ1) | 16.3% | 15.1% |
| Interquartile 75% (IQ3) | 23.4% | 32.4% |
| Interquartile Range (IQR) | 7.2% | 17.3% |
| Standard Deviation (Sample) | 8.2% | 12.8% |
| Standard Deviation (Population) | 8.1% | 12.7% |
Similar Demographics by 3 or more Vehicles in Household
Demographics Similar to Chileans by 3 or more Vehicles in Household
In terms of 3 or more vehicles in household, the demographic groups most similar to Chileans are Yugoslavian (19.7%, a difference of 0.010%), Estonian (19.7%, a difference of 0.020%), Immigrants from Costa Rica (19.7%, a difference of 0.090%), Immigrants from Cameroon (19.7%, a difference of 0.17%), and Immigrants from Guatemala (19.7%, a difference of 0.21%).
| Demographics | Rating | Rank | 3 or more Vehicles in Household |
| Thais | 71.1 /100 | #156 | Good 19.8% |
| Hungarians | 70.5 /100 | #157 | Good 19.8% |
| Armenians | 68.8 /100 | #158 | Good 19.8% |
| Immigrants | Pakistan | 68.2 /100 | #159 | Good 19.8% |
| Immigrants | Lebanon | 67.6 /100 | #160 | Good 19.8% |
| Immigrants | Guatemala | 65.6 /100 | #161 | Good 19.7% |
| Estonians | 63.2 /100 | #162 | Good 19.7% |
| Chileans | 63.0 /100 | #163 | Good 19.7% |
| Yugoslavians | 62.9 /100 | #164 | Good 19.7% |
| Immigrants | Costa Rica | 61.9 /100 | #165 | Good 19.7% |
| Immigrants | Cameroon | 60.9 /100 | #166 | Good 19.7% |
| Ukrainians | 58.9 /100 | #167 | Average 19.6% |
| Peruvians | 58.8 /100 | #168 | Average 19.6% |
| Immigrants | Denmark | 57.6 /100 | #169 | Average 19.6% |
| Iraqis | 56.0 /100 | #170 | Average 19.6% |
Demographics Similar to Apache by 3 or more Vehicles in Household
In terms of 3 or more vehicles in household, the demographic groups most similar to Apache are Belgian (21.2%, a difference of 0.080%), Immigrants from Indonesia (21.1%, a difference of 0.20%), Immigrants from Afghanistan (21.2%, a difference of 0.41%), Immigrants from Cambodia (21.1%, a difference of 0.43%), and Pakistani (21.0%, a difference of 0.57%).
| Demographics | Rating | Rank | 3 or more Vehicles in Household |
| Laotians | 99.6 /100 | #85 | Exceptional 21.5% |
| Delaware | 99.6 /100 | #86 | Exceptional 21.5% |
| Immigrants | Azores | 99.5 /100 | #87 | Exceptional 21.5% |
| French | 99.4 /100 | #88 | Exceptional 21.4% |
| Marshallese | 99.2 /100 | #89 | Exceptional 21.3% |
| Immigrants | Afghanistan | 99.1 /100 | #90 | Exceptional 21.2% |
| Belgians | 98.9 /100 | #91 | Exceptional 21.2% |
| Apache | 98.9 /100 | #92 | Exceptional 21.2% |
| Immigrants | Indonesia | 98.8 /100 | #93 | Exceptional 21.1% |
| Immigrants | Cambodia | 98.6 /100 | #94 | Exceptional 21.1% |
| Pakistanis | 98.5 /100 | #95 | Exceptional 21.0% |
| Cree | 98.4 /100 | #96 | Exceptional 21.0% |
| Canadians | 98.3 /100 | #97 | Exceptional 21.0% |
| Hmong | 98.2 /100 | #98 | Exceptional 21.0% |
| Alaska Natives | 98.2 /100 | #99 | Exceptional 21.0% |