Chickasaw vs Immigrants from South America Female Poverty
COMPARE
Chickasaw
Immigrants from South America
Female Poverty
Female Poverty Comparison
Chickasaw
Immigrants from South America
15.9%
FEMALE POVERTY
0.1/ 100
METRIC RATING
270th/ 347
METRIC RANK
13.7%
FEMALE POVERTY
30.6/ 100
METRIC RATING
195th/ 347
METRIC RANK
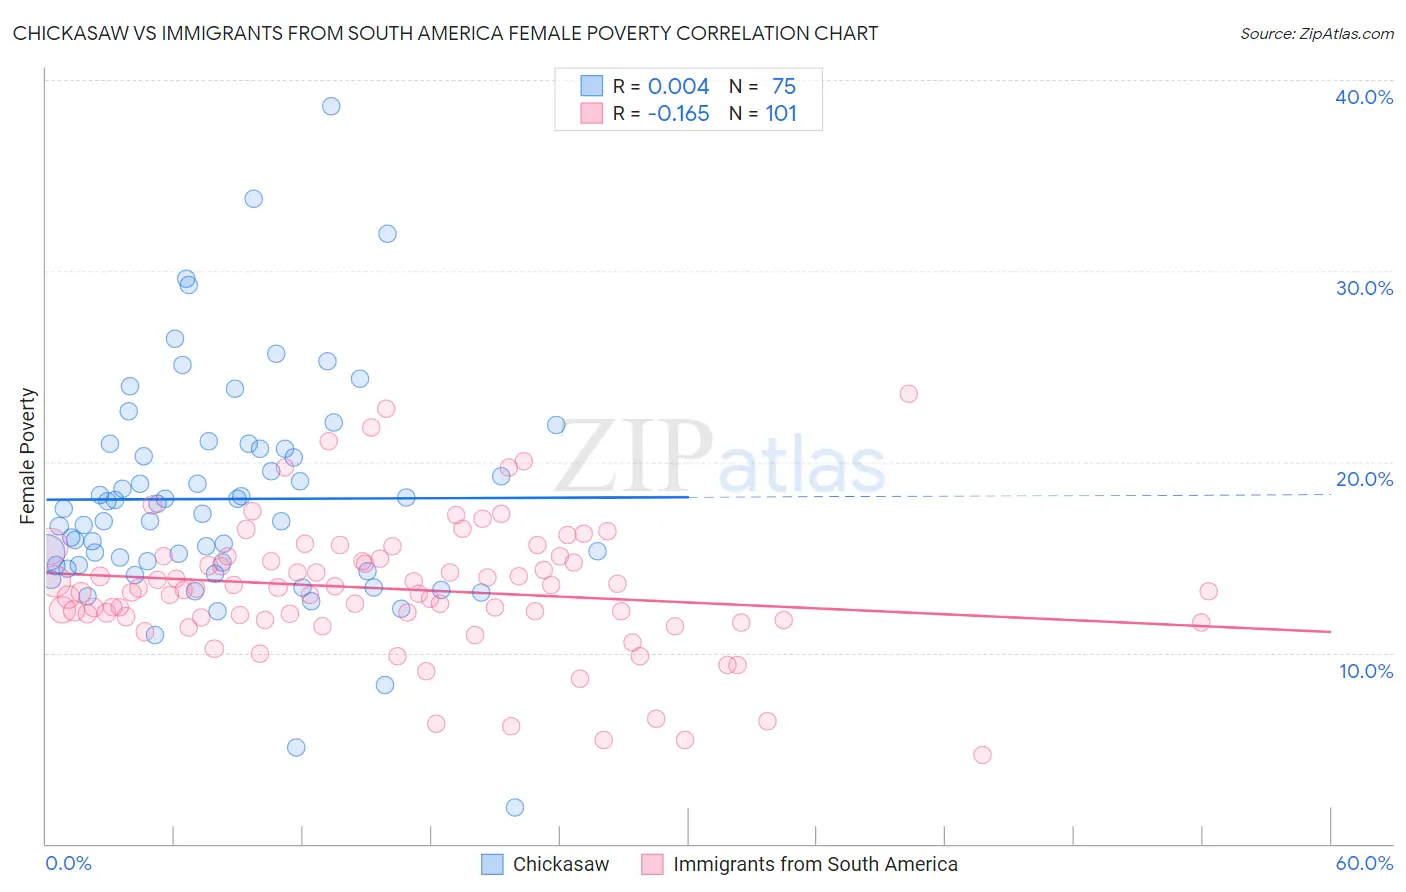
Chickasaw vs Immigrants from South America Female Poverty Correlation Chart
The statistical analysis conducted on geographies consisting of 147,658,289 people shows no correlation between the proportion of Chickasaw and poverty level among females in the United States with a correlation coefficient (R) of 0.004 and weighted average of 15.9%. Similarly, the statistical analysis conducted on geographies consisting of 485,828,470 people shows a poor negative correlation between the proportion of Immigrants from South America and poverty level among females in the United States with a correlation coefficient (R) of -0.165 and weighted average of 13.7%, a difference of 15.7%.
Female Poverty Correlation Summary
| Measurement | Chickasaw | Immigrants from South America |
| Minimum | 1.9% | 4.6% |
| Maximum | 38.6% | 23.5% |
| Range | 36.7% | 18.9% |
| Mean | 18.1% | 13.3% |
| Median | 17.3% | 13.3% |
| Interquartile 25% (IQ1) | 14.6% | 11.8% |
| Interquartile 75% (IQ3) | 20.7% | 15.0% |
| Interquartile Range (IQR) | 6.1% | 3.2% |
| Standard Deviation (Sample) | 5.9% | 3.5% |
| Standard Deviation (Population) | 5.9% | 3.5% |
Similar Demographics by Female Poverty
Demographics Similar to Chickasaw by Female Poverty
In terms of female poverty, the demographic groups most similar to Chickasaw are Iroquois (15.8%, a difference of 0.26%), Immigrants from St. Vincent and the Grenadines (15.9%, a difference of 0.28%), Belizean (15.9%, a difference of 0.50%), Haitian (15.9%, a difference of 0.51%), and Barbadian (15.9%, a difference of 0.51%).
| Demographics | Rating | Rank | Female Poverty |
| Cherokee | 0.1 /100 | #263 | Tragic 15.6% |
| Immigrants | Ecuador | 0.1 /100 | #264 | Tragic 15.6% |
| Immigrants | Liberia | 0.1 /100 | #265 | Tragic 15.7% |
| Immigrants | El Salvador | 0.1 /100 | #266 | Tragic 15.7% |
| Sub-Saharan Africans | 0.1 /100 | #267 | Tragic 15.8% |
| Immigrants | Nicaragua | 0.1 /100 | #268 | Tragic 15.8% |
| Iroquois | 0.1 /100 | #269 | Tragic 15.8% |
| Chickasaw | 0.1 /100 | #270 | Tragic 15.9% |
| Immigrants | St. Vincent and the Grenadines | 0.0 /100 | #271 | Tragic 15.9% |
| Belizeans | 0.0 /100 | #272 | Tragic 15.9% |
| Haitians | 0.0 /100 | #273 | Tragic 15.9% |
| Barbadians | 0.0 /100 | #274 | Tragic 15.9% |
| Immigrants | Barbados | 0.0 /100 | #275 | Tragic 16.0% |
| Central Americans | 0.0 /100 | #276 | Tragic 16.0% |
| Bangladeshis | 0.0 /100 | #277 | Tragic 16.0% |
Demographics Similar to Immigrants from South America by Female Poverty
In terms of female poverty, the demographic groups most similar to Immigrants from South America are Delaware (13.7%, a difference of 0.060%), Iraqi (13.7%, a difference of 0.12%), Immigrants from Costa Rica (13.7%, a difference of 0.14%), South American Indian (13.7%, a difference of 0.19%), and Immigrants from Kuwait (13.7%, a difference of 0.23%).
| Demographics | Rating | Rank | Female Poverty |
| Hawaiians | 39.9 /100 | #188 | Fair 13.6% |
| Uruguayans | 39.8 /100 | #189 | Fair 13.6% |
| Sierra Leoneans | 33.1 /100 | #190 | Fair 13.7% |
| Immigrants | Kuwait | 32.7 /100 | #191 | Fair 13.7% |
| Immigrants | Costa Rica | 31.9 /100 | #192 | Fair 13.7% |
| Iraqis | 31.8 /100 | #193 | Fair 13.7% |
| Delaware | 31.1 /100 | #194 | Fair 13.7% |
| Immigrants | South America | 30.6 /100 | #195 | Fair 13.7% |
| South American Indians | 28.9 /100 | #196 | Fair 13.7% |
| Arabs | 28.6 /100 | #197 | Fair 13.7% |
| Immigrants | Uganda | 28.5 /100 | #198 | Fair 13.7% |
| Immigrants | Lebanon | 25.6 /100 | #199 | Fair 13.8% |
| Spanish | 21.4 /100 | #200 | Fair 13.9% |
| Immigrants | Kenya | 21.1 /100 | #201 | Fair 13.9% |
| Hmong | 21.1 /100 | #202 | Fair 13.9% |