Carpatho Rusyn vs Immigrants from South America Female Poverty
COMPARE
Carpatho Rusyn
Immigrants from South America
Female Poverty
Female Poverty Comparison
Carpatho Rusyns
Immigrants from South America
12.2%
FEMALE POVERTY
97.6/ 100
METRIC RATING
71st/ 347
METRIC RANK
13.7%
FEMALE POVERTY
30.6/ 100
METRIC RATING
195th/ 347
METRIC RANK
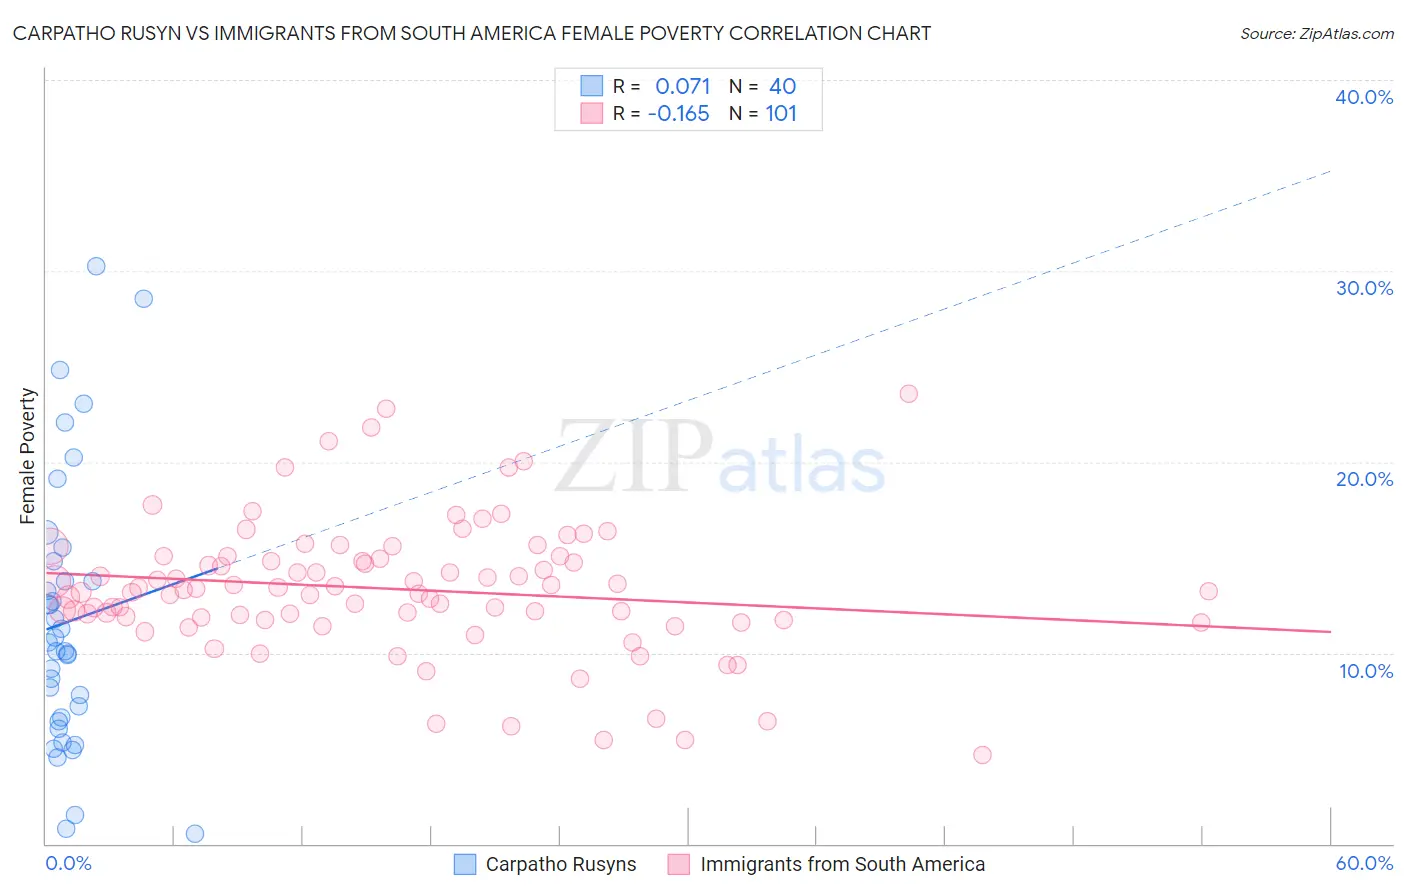
Carpatho Rusyn vs Immigrants from South America Female Poverty Correlation Chart
The statistical analysis conducted on geographies consisting of 58,861,278 people shows a slight positive correlation between the proportion of Carpatho Rusyns and poverty level among females in the United States with a correlation coefficient (R) of 0.071 and weighted average of 12.2%. Similarly, the statistical analysis conducted on geographies consisting of 485,828,470 people shows a poor negative correlation between the proportion of Immigrants from South America and poverty level among females in the United States with a correlation coefficient (R) of -0.165 and weighted average of 13.7%, a difference of 11.9%.
Female Poverty Correlation Summary
| Measurement | Carpatho Rusyn | Immigrants from South America |
| Minimum | 0.50% | 4.6% |
| Maximum | 30.2% | 23.5% |
| Range | 29.7% | 18.9% |
| Mean | 11.6% | 13.3% |
| Median | 10.3% | 13.3% |
| Interquartile 25% (IQ1) | 6.5% | 11.8% |
| Interquartile 75% (IQ3) | 14.3% | 15.0% |
| Interquartile Range (IQR) | 7.8% | 3.2% |
| Standard Deviation (Sample) | 7.1% | 3.5% |
| Standard Deviation (Population) | 7.0% | 3.5% |
Similar Demographics by Female Poverty
Demographics Similar to Carpatho Rusyns by Female Poverty
In terms of female poverty, the demographic groups most similar to Carpatho Rusyns are Cambodian (12.2%, a difference of 0.030%), Zimbabwean (12.3%, a difference of 0.050%), Immigrants from Canada (12.3%, a difference of 0.060%), Immigrants from Belgium (12.2%, a difference of 0.13%), and Swiss (12.2%, a difference of 0.15%).
| Demographics | Rating | Rank | Female Poverty |
| Germans | 98.0 /100 | #64 | Exceptional 12.2% |
| Indians (Asian) | 97.9 /100 | #65 | Exceptional 12.2% |
| Austrians | 97.9 /100 | #66 | Exceptional 12.2% |
| Immigrants | Eastern Asia | 97.8 /100 | #67 | Exceptional 12.2% |
| Immigrants | Netherlands | 97.8 /100 | #68 | Exceptional 12.2% |
| Swiss | 97.7 /100 | #69 | Exceptional 12.2% |
| Immigrants | Belgium | 97.7 /100 | #70 | Exceptional 12.2% |
| Carpatho Rusyns | 97.6 /100 | #71 | Exceptional 12.2% |
| Cambodians | 97.5 /100 | #72 | Exceptional 12.2% |
| Zimbabweans | 97.5 /100 | #73 | Exceptional 12.3% |
| Immigrants | Canada | 97.5 /100 | #74 | Exceptional 12.3% |
| Europeans | 97.4 /100 | #75 | Exceptional 12.3% |
| Immigrants | Eastern Europe | 97.2 /100 | #76 | Exceptional 12.3% |
| Serbians | 97.2 /100 | #77 | Exceptional 12.3% |
| Egyptians | 97.2 /100 | #78 | Exceptional 12.3% |
Demographics Similar to Immigrants from South America by Female Poverty
In terms of female poverty, the demographic groups most similar to Immigrants from South America are Delaware (13.7%, a difference of 0.060%), Iraqi (13.7%, a difference of 0.12%), Immigrants from Costa Rica (13.7%, a difference of 0.14%), South American Indian (13.7%, a difference of 0.19%), and Immigrants from Kuwait (13.7%, a difference of 0.23%).
| Demographics | Rating | Rank | Female Poverty |
| Hawaiians | 39.9 /100 | #188 | Fair 13.6% |
| Uruguayans | 39.8 /100 | #189 | Fair 13.6% |
| Sierra Leoneans | 33.1 /100 | #190 | Fair 13.7% |
| Immigrants | Kuwait | 32.7 /100 | #191 | Fair 13.7% |
| Immigrants | Costa Rica | 31.9 /100 | #192 | Fair 13.7% |
| Iraqis | 31.8 /100 | #193 | Fair 13.7% |
| Delaware | 31.1 /100 | #194 | Fair 13.7% |
| Immigrants | South America | 30.6 /100 | #195 | Fair 13.7% |
| South American Indians | 28.9 /100 | #196 | Fair 13.7% |
| Arabs | 28.6 /100 | #197 | Fair 13.7% |
| Immigrants | Uganda | 28.5 /100 | #198 | Fair 13.7% |
| Immigrants | Lebanon | 25.6 /100 | #199 | Fair 13.8% |
| Spanish | 21.4 /100 | #200 | Fair 13.9% |
| Immigrants | Kenya | 21.1 /100 | #201 | Fair 13.9% |
| Hmong | 21.1 /100 | #202 | Fair 13.9% |