Eastern European vs Immigrants from South America Female Poverty
COMPARE
Eastern European
Immigrants from South America
Female Poverty
Female Poverty Comparison
Eastern Europeans
Immigrants from South America
11.5%
FEMALE POVERTY
99.7/ 100
METRIC RATING
20th/ 347
METRIC RANK
13.7%
FEMALE POVERTY
30.6/ 100
METRIC RATING
195th/ 347
METRIC RANK
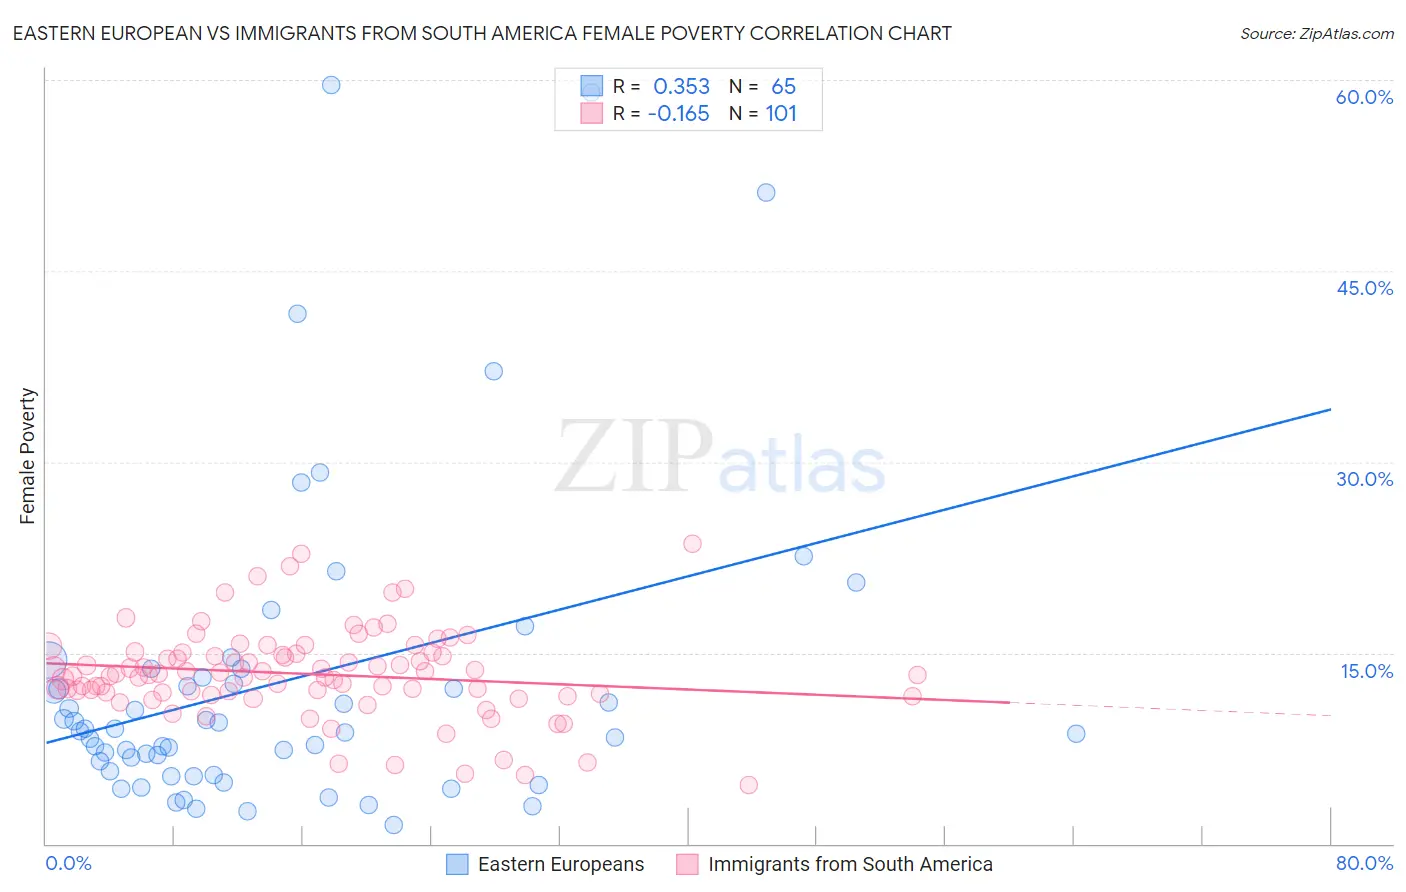
Eastern European vs Immigrants from South America Female Poverty Correlation Chart
The statistical analysis conducted on geographies consisting of 460,773,883 people shows a mild positive correlation between the proportion of Eastern Europeans and poverty level among females in the United States with a correlation coefficient (R) of 0.353 and weighted average of 11.5%. Similarly, the statistical analysis conducted on geographies consisting of 485,828,470 people shows a poor negative correlation between the proportion of Immigrants from South America and poverty level among females in the United States with a correlation coefficient (R) of -0.165 and weighted average of 13.7%, a difference of 18.9%.
Female Poverty Correlation Summary
| Measurement | Eastern European | Immigrants from South America |
| Minimum | 1.4% | 4.6% |
| Maximum | 59.6% | 23.5% |
| Range | 58.2% | 18.9% |
| Mean | 12.7% | 13.3% |
| Median | 8.8% | 13.3% |
| Interquartile 25% (IQ1) | 5.5% | 11.8% |
| Interquartile 75% (IQ3) | 13.4% | 15.0% |
| Interquartile Range (IQR) | 7.9% | 3.2% |
| Standard Deviation (Sample) | 12.4% | 3.5% |
| Standard Deviation (Population) | 12.3% | 3.5% |
Similar Demographics by Female Poverty
Demographics Similar to Eastern Europeans by Female Poverty
In terms of female poverty, the demographic groups most similar to Eastern Europeans are Norwegian (11.5%, a difference of 0.23%), Immigrants from Scotland (11.5%, a difference of 0.27%), Bolivian (11.5%, a difference of 0.32%), Immigrants from Bolivia (11.5%, a difference of 0.39%), and Italian (11.6%, a difference of 0.50%).
| Demographics | Rating | Rank | Female Poverty |
| Immigrants | Lithuania | 99.9 /100 | #13 | Exceptional 11.3% |
| Lithuanians | 99.8 /100 | #14 | Exceptional 11.4% |
| Latvians | 99.8 /100 | #15 | Exceptional 11.4% |
| Immigrants | Bolivia | 99.8 /100 | #16 | Exceptional 11.5% |
| Bolivians | 99.8 /100 | #17 | Exceptional 11.5% |
| Immigrants | Scotland | 99.8 /100 | #18 | Exceptional 11.5% |
| Norwegians | 99.8 /100 | #19 | Exceptional 11.5% |
| Eastern Europeans | 99.7 /100 | #20 | Exceptional 11.5% |
| Italians | 99.7 /100 | #21 | Exceptional 11.6% |
| Swedes | 99.7 /100 | #22 | Exceptional 11.6% |
| Burmese | 99.7 /100 | #23 | Exceptional 11.6% |
| Luxembourgers | 99.7 /100 | #24 | Exceptional 11.6% |
| Immigrants | Northern Europe | 99.6 /100 | #25 | Exceptional 11.6% |
| Croatians | 99.6 /100 | #26 | Exceptional 11.6% |
| Iranians | 99.6 /100 | #27 | Exceptional 11.7% |
Demographics Similar to Immigrants from South America by Female Poverty
In terms of female poverty, the demographic groups most similar to Immigrants from South America are Delaware (13.7%, a difference of 0.060%), Iraqi (13.7%, a difference of 0.12%), Immigrants from Costa Rica (13.7%, a difference of 0.14%), South American Indian (13.7%, a difference of 0.19%), and Immigrants from Kuwait (13.7%, a difference of 0.23%).
| Demographics | Rating | Rank | Female Poverty |
| Hawaiians | 39.9 /100 | #188 | Fair 13.6% |
| Uruguayans | 39.8 /100 | #189 | Fair 13.6% |
| Sierra Leoneans | 33.1 /100 | #190 | Fair 13.7% |
| Immigrants | Kuwait | 32.7 /100 | #191 | Fair 13.7% |
| Immigrants | Costa Rica | 31.9 /100 | #192 | Fair 13.7% |
| Iraqis | 31.8 /100 | #193 | Fair 13.7% |
| Delaware | 31.1 /100 | #194 | Fair 13.7% |
| Immigrants | South America | 30.6 /100 | #195 | Fair 13.7% |
| South American Indians | 28.9 /100 | #196 | Fair 13.7% |
| Arabs | 28.6 /100 | #197 | Fair 13.7% |
| Immigrants | Uganda | 28.5 /100 | #198 | Fair 13.7% |
| Immigrants | Lebanon | 25.6 /100 | #199 | Fair 13.8% |
| Spanish | 21.4 /100 | #200 | Fair 13.9% |
| Immigrants | Kenya | 21.1 /100 | #201 | Fair 13.9% |
| Hmong | 21.1 /100 | #202 | Fair 13.9% |