Chickasaw vs Immigrants from Israel Female Poverty
COMPARE
Chickasaw
Immigrants from Israel
Female Poverty
Female Poverty Comparison
Chickasaw
Immigrants from Israel
15.9%
FEMALE POVERTY
0.1/ 100
METRIC RATING
270th/ 347
METRIC RANK
12.6%
FEMALE POVERTY
92.0/ 100
METRIC RATING
112th/ 347
METRIC RANK
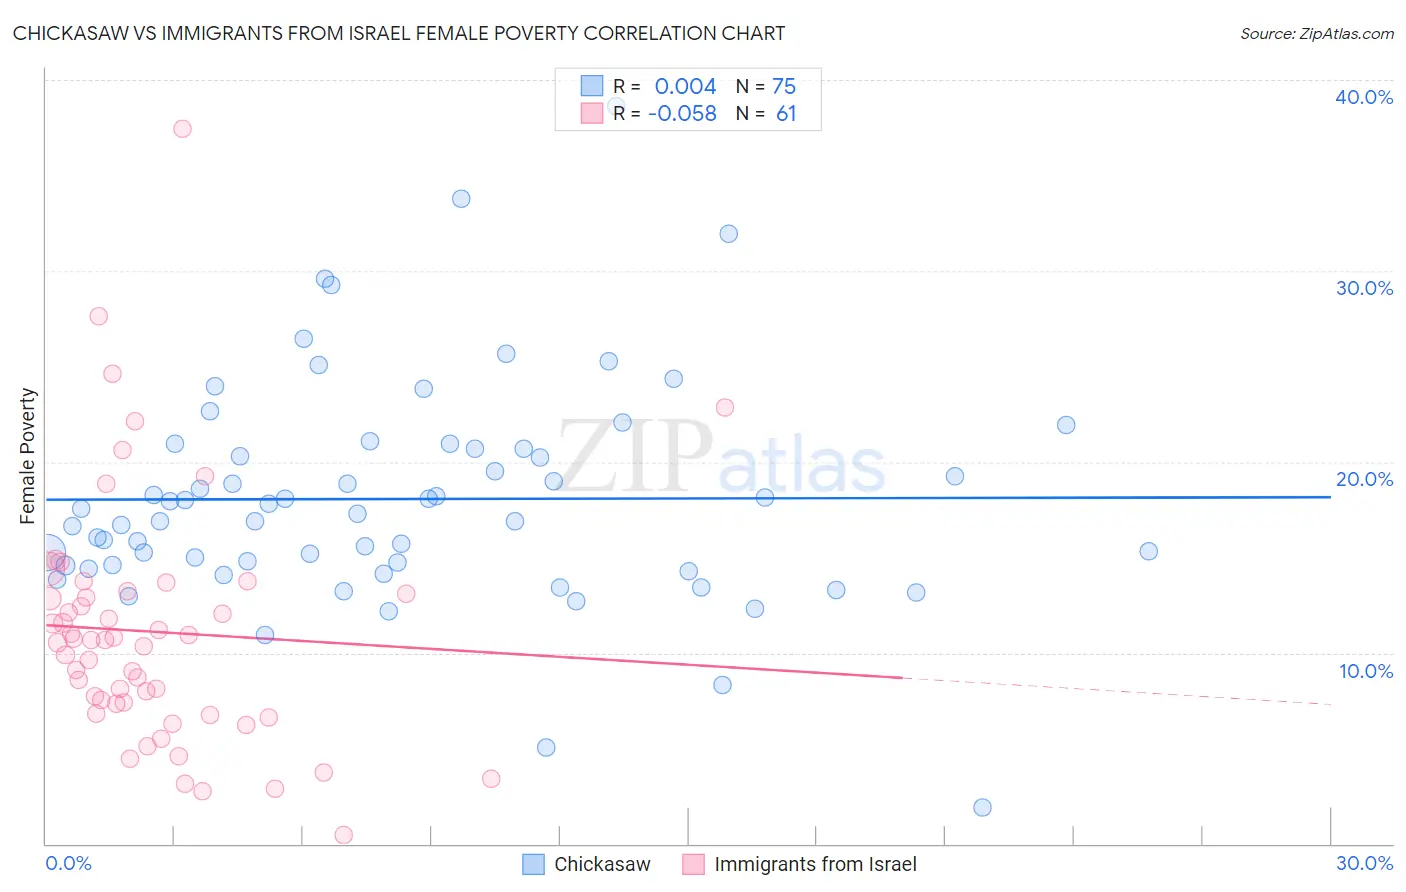
Chickasaw vs Immigrants from Israel Female Poverty Correlation Chart
The statistical analysis conducted on geographies consisting of 147,658,289 people shows no correlation between the proportion of Chickasaw and poverty level among females in the United States with a correlation coefficient (R) of 0.004 and weighted average of 15.9%. Similarly, the statistical analysis conducted on geographies consisting of 209,961,688 people shows a slight negative correlation between the proportion of Immigrants from Israel and poverty level among females in the United States with a correlation coefficient (R) of -0.058 and weighted average of 12.6%, a difference of 25.4%.
Female Poverty Correlation Summary
| Measurement | Chickasaw | Immigrants from Israel |
| Minimum | 1.9% | 0.44% |
| Maximum | 38.6% | 37.4% |
| Range | 36.7% | 37.0% |
| Mean | 18.1% | 11.1% |
| Median | 17.3% | 10.6% |
| Interquartile 25% (IQ1) | 14.6% | 7.1% |
| Interquartile 75% (IQ3) | 20.7% | 13.2% |
| Interquartile Range (IQR) | 6.1% | 6.1% |
| Standard Deviation (Sample) | 5.9% | 6.4% |
| Standard Deviation (Population) | 5.9% | 6.4% |
Similar Demographics by Female Poverty
Demographics Similar to Chickasaw by Female Poverty
In terms of female poverty, the demographic groups most similar to Chickasaw are Iroquois (15.8%, a difference of 0.26%), Immigrants from St. Vincent and the Grenadines (15.9%, a difference of 0.28%), Belizean (15.9%, a difference of 0.50%), Haitian (15.9%, a difference of 0.51%), and Barbadian (15.9%, a difference of 0.51%).
| Demographics | Rating | Rank | Female Poverty |
| Cherokee | 0.1 /100 | #263 | Tragic 15.6% |
| Immigrants | Ecuador | 0.1 /100 | #264 | Tragic 15.6% |
| Immigrants | Liberia | 0.1 /100 | #265 | Tragic 15.7% |
| Immigrants | El Salvador | 0.1 /100 | #266 | Tragic 15.7% |
| Sub-Saharan Africans | 0.1 /100 | #267 | Tragic 15.8% |
| Immigrants | Nicaragua | 0.1 /100 | #268 | Tragic 15.8% |
| Iroquois | 0.1 /100 | #269 | Tragic 15.8% |
| Chickasaw | 0.1 /100 | #270 | Tragic 15.9% |
| Immigrants | St. Vincent and the Grenadines | 0.0 /100 | #271 | Tragic 15.9% |
| Belizeans | 0.0 /100 | #272 | Tragic 15.9% |
| Haitians | 0.0 /100 | #273 | Tragic 15.9% |
| Barbadians | 0.0 /100 | #274 | Tragic 15.9% |
| Immigrants | Barbados | 0.0 /100 | #275 | Tragic 16.0% |
| Central Americans | 0.0 /100 | #276 | Tragic 16.0% |
| Bangladeshis | 0.0 /100 | #277 | Tragic 16.0% |
Demographics Similar to Immigrants from Israel by Female Poverty
In terms of female poverty, the demographic groups most similar to Immigrants from Israel are Canadian (12.7%, a difference of 0.030%), Soviet Union (12.6%, a difference of 0.14%), Welsh (12.7%, a difference of 0.15%), Puget Sound Salish (12.7%, a difference of 0.17%), and Immigrants from Russia (12.7%, a difference of 0.29%).
| Demographics | Rating | Rank | Female Poverty |
| Scottish | 94.1 /100 | #105 | Exceptional 12.5% |
| Immigrants | Turkey | 93.8 /100 | #106 | Exceptional 12.6% |
| Laotians | 93.4 /100 | #107 | Exceptional 12.6% |
| Portuguese | 93.1 /100 | #108 | Exceptional 12.6% |
| Immigrants | Zimbabwe | 93.1 /100 | #109 | Exceptional 12.6% |
| Paraguayans | 93.0 /100 | #110 | Exceptional 12.6% |
| Soviet Union | 92.4 /100 | #111 | Exceptional 12.6% |
| Immigrants | Israel | 92.0 /100 | #112 | Exceptional 12.6% |
| Canadians | 92.0 /100 | #113 | Exceptional 12.7% |
| Welsh | 91.6 /100 | #114 | Exceptional 12.7% |
| Puget Sound Salish | 91.5 /100 | #115 | Exceptional 12.7% |
| Immigrants | Russia | 91.2 /100 | #116 | Exceptional 12.7% |
| Immigrants | Southern Europe | 90.9 /100 | #117 | Exceptional 12.7% |
| Sri Lankans | 90.9 /100 | #118 | Exceptional 12.7% |
| Albanians | 90.8 /100 | #119 | Exceptional 12.7% |