Immigrants from St. Vincent and the Grenadines vs Blackfeet Poverty
COMPARE
Immigrants from St. Vincent and the Grenadines
Blackfeet
Poverty
Poverty Comparison
Immigrants from St. Vincent and the Grenadines
Blackfeet
14.9%
POVERTY
0.0/ 100
METRIC RATING
279th/ 347
METRIC RANK
15.2%
POVERTY
0.0/ 100
METRIC RATING
294th/ 347
METRIC RANK
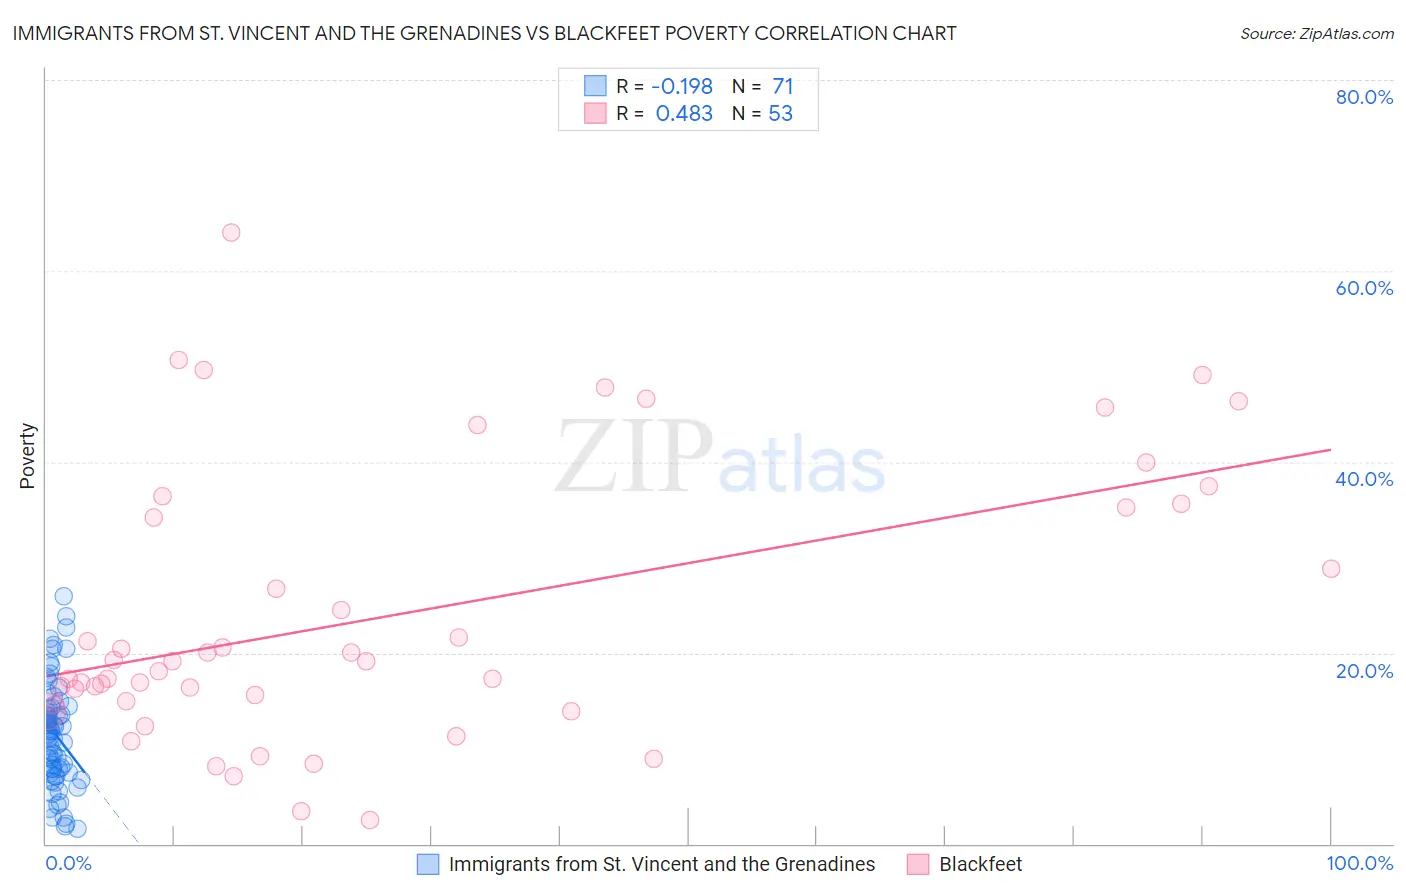
Immigrants from St. Vincent and the Grenadines vs Blackfeet Poverty Correlation Chart
The statistical analysis conducted on geographies consisting of 56,091,353 people shows a poor negative correlation between the proportion of Immigrants from St. Vincent and the Grenadines and poverty level in the United States with a correlation coefficient (R) of -0.198 and weighted average of 14.9%. Similarly, the statistical analysis conducted on geographies consisting of 309,474,623 people shows a moderate positive correlation between the proportion of Blackfeet and poverty level in the United States with a correlation coefficient (R) of 0.483 and weighted average of 15.2%, a difference of 2.2%.
Poverty Correlation Summary
| Measurement | Immigrants from St. Vincent and the Grenadines | Blackfeet |
| Minimum | 1.6% | 2.5% |
| Maximum | 25.9% | 64.1% |
| Range | 24.3% | 61.6% |
| Mean | 11.5% | 23.9% |
| Median | 11.5% | 19.1% |
| Interquartile 25% (IQ1) | 7.5% | 14.7% |
| Interquartile 75% (IQ3) | 14.2% | 35.4% |
| Interquartile Range (IQR) | 6.7% | 20.7% |
| Standard Deviation (Sample) | 5.5% | 14.4% |
| Standard Deviation (Population) | 5.5% | 14.3% |
Demographics Similar to Immigrants from St. Vincent and the Grenadines and Blackfeet by Poverty
In terms of poverty, the demographic groups most similar to Immigrants from St. Vincent and the Grenadines are Haitian (14.9%, a difference of 0.20%), Immigrants from Barbados (14.9%, a difference of 0.27%), Belizean (14.8%, a difference of 0.29%), Bangladeshi (14.8%, a difference of 0.31%), and Immigrants from Bahamas (14.8%, a difference of 0.37%). Similarly, the demographic groups most similar to Blackfeet are Guatemalan (15.3%, a difference of 0.42%), Hispanic or Latino (15.3%, a difference of 0.43%), Indonesian (15.1%, a difference of 0.44%), Immigrants from Zaire (15.1%, a difference of 0.44%), and Immigrants from Cabo Verde (15.1%, a difference of 0.49%).
| Demographics | Rating | Rank | Poverty |
| Immigrants | Bahamas | 0.0 /100 | #276 | Tragic 14.8% |
| Bangladeshis | 0.0 /100 | #277 | Tragic 14.8% |
| Belizeans | 0.0 /100 | #278 | Tragic 14.8% |
| Immigrants | St. Vincent and the Grenadines | 0.0 /100 | #279 | Tragic 14.9% |
| Haitians | 0.0 /100 | #280 | Tragic 14.9% |
| Immigrants | Barbados | 0.0 /100 | #281 | Tragic 14.9% |
| Comanche | 0.0 /100 | #282 | Tragic 15.0% |
| Immigrants | Haiti | 0.0 /100 | #283 | Tragic 15.0% |
| West Indians | 0.0 /100 | #284 | Tragic 15.0% |
| Vietnamese | 0.0 /100 | #285 | Tragic 15.0% |
| Immigrants | Latin America | 0.0 /100 | #286 | Tragic 15.0% |
| Inupiat | 0.0 /100 | #287 | Tragic 15.1% |
| Yaqui | 0.0 /100 | #288 | Tragic 15.1% |
| Immigrants | Belize | 0.0 /100 | #289 | Tragic 15.1% |
| Mexicans | 0.0 /100 | #290 | Tragic 15.1% |
| Immigrants | Cabo Verde | 0.0 /100 | #291 | Tragic 15.1% |
| Indonesians | 0.0 /100 | #292 | Tragic 15.1% |
| Immigrants | Zaire | 0.0 /100 | #293 | Tragic 15.1% |
| Blackfeet | 0.0 /100 | #294 | Tragic 15.2% |
| Guatemalans | 0.0 /100 | #295 | Tragic 15.3% |
| Hispanics or Latinos | 0.0 /100 | #296 | Tragic 15.3% |