Immigrants from Uzbekistan vs Blackfeet Poverty
COMPARE
Immigrants from Uzbekistan
Blackfeet
Poverty
Poverty Comparison
Immigrants from Uzbekistan
Blackfeet
13.3%
POVERTY
3.2/ 100
METRIC RATING
217th/ 347
METRIC RANK
15.2%
POVERTY
0.0/ 100
METRIC RATING
294th/ 347
METRIC RANK
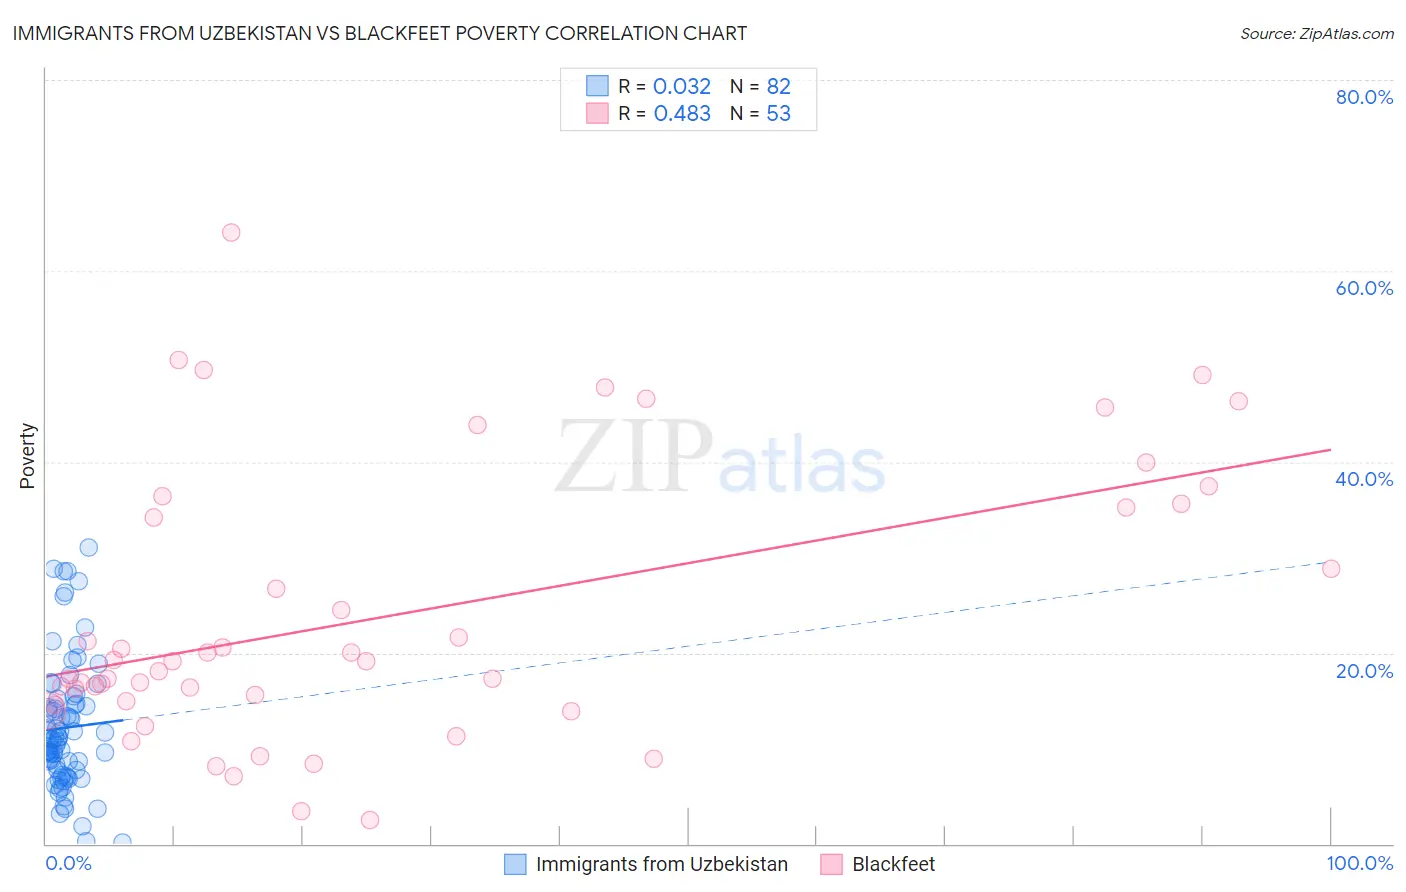
Immigrants from Uzbekistan vs Blackfeet Poverty Correlation Chart
The statistical analysis conducted on geographies consisting of 118,719,831 people shows no correlation between the proportion of Immigrants from Uzbekistan and poverty level in the United States with a correlation coefficient (R) of 0.032 and weighted average of 13.3%. Similarly, the statistical analysis conducted on geographies consisting of 309,474,623 people shows a moderate positive correlation between the proportion of Blackfeet and poverty level in the United States with a correlation coefficient (R) of 0.483 and weighted average of 15.2%, a difference of 14.0%.
Poverty Correlation Summary
| Measurement | Immigrants from Uzbekistan | Blackfeet |
| Minimum | 0.14% | 2.5% |
| Maximum | 31.1% | 64.1% |
| Range | 30.9% | 61.6% |
| Mean | 12.2% | 23.9% |
| Median | 10.9% | 19.1% |
| Interquartile 25% (IQ1) | 7.7% | 14.7% |
| Interquartile 75% (IQ3) | 14.7% | 35.4% |
| Interquartile Range (IQR) | 7.0% | 20.7% |
| Standard Deviation (Sample) | 6.7% | 14.4% |
| Standard Deviation (Population) | 6.7% | 14.3% |
Similar Demographics by Poverty
Demographics Similar to Immigrants from Uzbekistan by Poverty
In terms of poverty, the demographic groups most similar to Immigrants from Uzbekistan are Japanese (13.3%, a difference of 0.040%), Nonimmigrants (13.3%, a difference of 0.040%), Immigrants from Thailand (13.3%, a difference of 0.060%), Immigrants from Cambodia (13.4%, a difference of 0.19%), and American (13.4%, a difference of 0.28%).
| Demographics | Rating | Rank | Poverty |
| Immigrants | Azores | 6.1 /100 | #210 | Tragic 13.1% |
| Moroccans | 5.2 /100 | #211 | Tragic 13.2% |
| Immigrants | Immigrants | 4.3 /100 | #212 | Tragic 13.2% |
| Immigrants | Panama | 4.1 /100 | #213 | Tragic 13.3% |
| Bermudans | 3.7 /100 | #214 | Tragic 13.3% |
| Japanese | 3.3 /100 | #215 | Tragic 13.3% |
| Immigrants | Nonimmigrants | 3.3 /100 | #216 | Tragic 13.3% |
| Immigrants | Uzbekistan | 3.2 /100 | #217 | Tragic 13.3% |
| Immigrants | Thailand | 3.1 /100 | #218 | Tragic 13.3% |
| Immigrants | Cambodia | 3.0 /100 | #219 | Tragic 13.4% |
| Americans | 2.9 /100 | #220 | Tragic 13.4% |
| Alsatians | 2.6 /100 | #221 | Tragic 13.4% |
| Immigrants | Micronesia | 2.6 /100 | #222 | Tragic 13.4% |
| Immigrants | Africa | 2.5 /100 | #223 | Tragic 13.4% |
| Immigrants | Eritrea | 2.4 /100 | #224 | Tragic 13.4% |
Demographics Similar to Blackfeet by Poverty
In terms of poverty, the demographic groups most similar to Blackfeet are Guatemalan (15.3%, a difference of 0.42%), Hispanic or Latino (15.3%, a difference of 0.43%), Indonesian (15.1%, a difference of 0.44%), Immigrants from Zaire (15.1%, a difference of 0.44%), and Immigrants from Bangladesh (15.3%, a difference of 0.47%).
| Demographics | Rating | Rank | Poverty |
| Inupiat | 0.0 /100 | #287 | Tragic 15.1% |
| Yaqui | 0.0 /100 | #288 | Tragic 15.1% |
| Immigrants | Belize | 0.0 /100 | #289 | Tragic 15.1% |
| Mexicans | 0.0 /100 | #290 | Tragic 15.1% |
| Immigrants | Cabo Verde | 0.0 /100 | #291 | Tragic 15.1% |
| Indonesians | 0.0 /100 | #292 | Tragic 15.1% |
| Immigrants | Zaire | 0.0 /100 | #293 | Tragic 15.1% |
| Blackfeet | 0.0 /100 | #294 | Tragic 15.2% |
| Guatemalans | 0.0 /100 | #295 | Tragic 15.3% |
| Hispanics or Latinos | 0.0 /100 | #296 | Tragic 15.3% |
| Immigrants | Bangladesh | 0.0 /100 | #297 | Tragic 15.3% |
| Immigrants | Senegal | 0.0 /100 | #298 | Tragic 15.3% |
| Senegalese | 0.0 /100 | #299 | Tragic 15.3% |
| Immigrants | Central America | 0.0 /100 | #300 | Tragic 15.4% |
| Bahamians | 0.0 /100 | #301 | Tragic 15.4% |