Central American vs Chickasaw Married-Couple Family Poverty
COMPARE
Central American
Chickasaw
Married-Couple Family Poverty
Married-Couple Family Poverty Comparison
Central Americans
Chickasaw
6.7%
MARRIED-COUPLE FAMILY POVERTY
0.0/ 100
METRIC RATING
301st/ 347
METRIC RANK
5.8%
MARRIED-COUPLE FAMILY POVERTY
2.3/ 100
METRIC RATING
244th/ 347
METRIC RANK
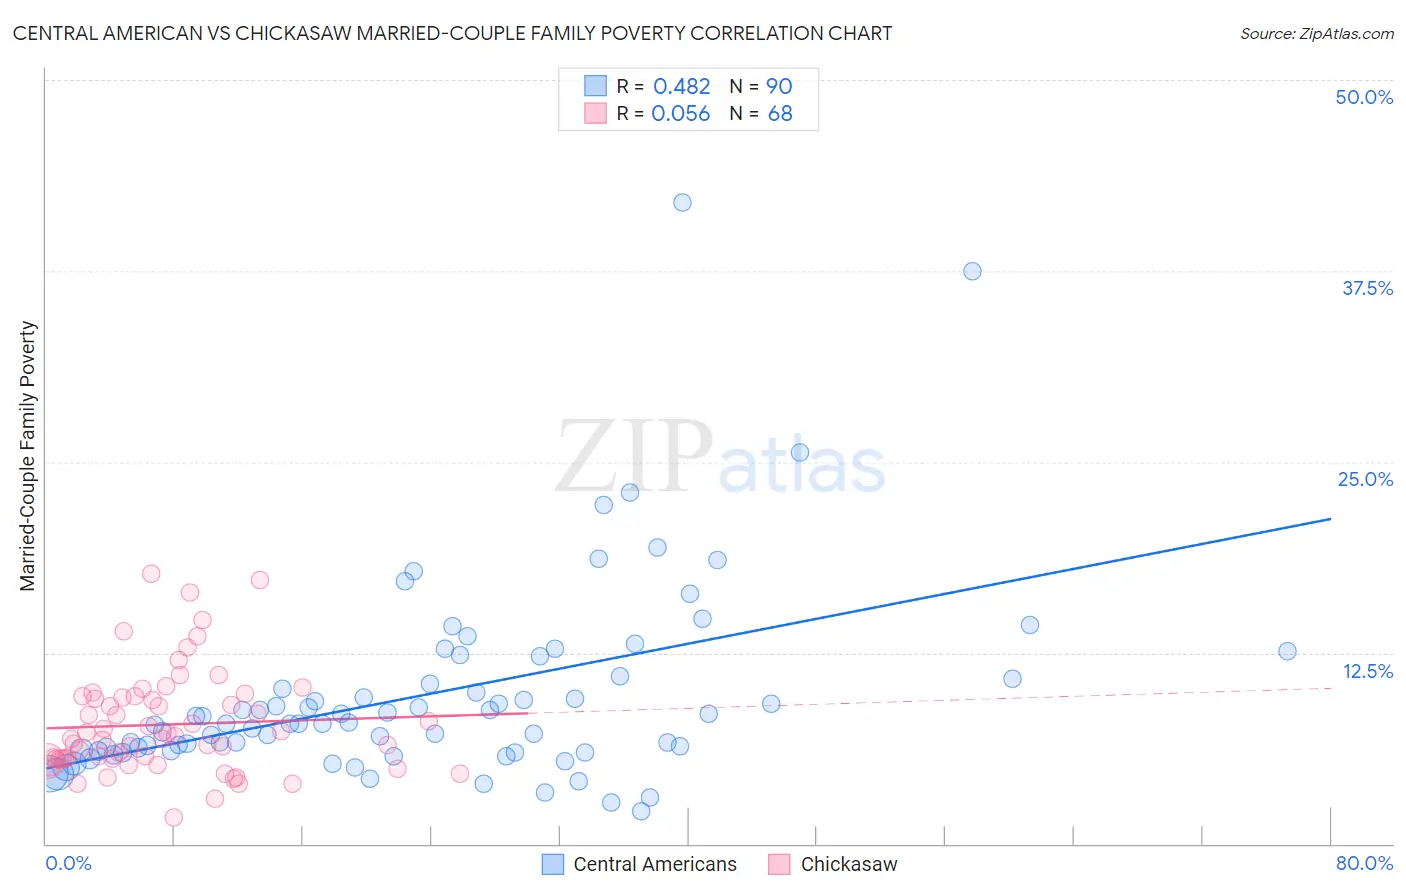
Central American vs Chickasaw Married-Couple Family Poverty Correlation Chart
The statistical analysis conducted on geographies consisting of 497,895,847 people shows a moderate positive correlation between the proportion of Central Americans and poverty level among married-couple families in the United States with a correlation coefficient (R) of 0.482 and weighted average of 6.7%. Similarly, the statistical analysis conducted on geographies consisting of 147,342,221 people shows a slight positive correlation between the proportion of Chickasaw and poverty level among married-couple families in the United States with a correlation coefficient (R) of 0.056 and weighted average of 5.8%, a difference of 16.4%.
Married-Couple Family Poverty Correlation Summary
| Measurement | Central American | Chickasaw |
| Minimum | 2.1% | 1.7% |
| Maximum | 41.9% | 17.6% |
| Range | 39.8% | 16.0% |
| Mean | 9.7% | 7.8% |
| Median | 7.9% | 7.0% |
| Interquartile 25% (IQ1) | 6.1% | 5.5% |
| Interquartile 75% (IQ3) | 10.8% | 9.6% |
| Interquartile Range (IQR) | 4.7% | 4.1% |
| Standard Deviation (Sample) | 6.5% | 3.4% |
| Standard Deviation (Population) | 6.4% | 3.3% |
Similar Demographics by Married-Couple Family Poverty
Demographics Similar to Central Americans by Married-Couple Family Poverty
In terms of married-couple family poverty, the demographic groups most similar to Central Americans are Immigrants from Ecuador (6.7%, a difference of 0.14%), Immigrants from El Salvador (6.8%, a difference of 0.42%), Immigrants from Belize (6.7%, a difference of 0.60%), Nicaraguan (6.7%, a difference of 0.75%), and Cuban (6.8%, a difference of 0.86%).
| Demographics | Rating | Rank | Married-Couple Family Poverty |
| Bahamians | 0.0 /100 | #294 | Tragic 6.6% |
| Immigrants | Uzbekistan | 0.0 /100 | #295 | Tragic 6.6% |
| U.S. Virgin Islanders | 0.0 /100 | #296 | Tragic 6.6% |
| Kiowa | 0.0 /100 | #297 | Tragic 6.6% |
| Immigrants | Guyana | 0.0 /100 | #298 | Tragic 6.7% |
| Nicaraguans | 0.0 /100 | #299 | Tragic 6.7% |
| Immigrants | Belize | 0.0 /100 | #300 | Tragic 6.7% |
| Central Americans | 0.0 /100 | #301 | Tragic 6.7% |
| Immigrants | Ecuador | 0.0 /100 | #302 | Tragic 6.7% |
| Immigrants | El Salvador | 0.0 /100 | #303 | Tragic 6.8% |
| Cubans | 0.0 /100 | #304 | Tragic 6.8% |
| Haitians | 0.0 /100 | #305 | Tragic 6.8% |
| Immigrants | Haiti | 0.0 /100 | #306 | Tragic 7.0% |
| Guatemalans | 0.0 /100 | #307 | Tragic 7.0% |
| Spanish American Indians | 0.0 /100 | #308 | Tragic 7.1% |
Demographics Similar to Chickasaw by Married-Couple Family Poverty
In terms of married-couple family poverty, the demographic groups most similar to Chickasaw are Somali (5.8%, a difference of 0.010%), Immigrants from Afghanistan (5.8%, a difference of 0.15%), Immigrants from Western Africa (5.8%, a difference of 0.17%), Immigrants from Panama (5.8%, a difference of 0.26%), and Fijian (5.8%, a difference of 0.28%).
| Demographics | Rating | Rank | Married-Couple Family Poverty |
| Immigrants | South America | 3.1 /100 | #237 | Tragic 5.7% |
| Cherokee | 2.7 /100 | #238 | Tragic 5.8% |
| Venezuelans | 2.7 /100 | #239 | Tragic 5.8% |
| Fijians | 2.5 /100 | #240 | Tragic 5.8% |
| Immigrants | Panama | 2.5 /100 | #241 | Tragic 5.8% |
| Immigrants | Western Africa | 2.4 /100 | #242 | Tragic 5.8% |
| Somalis | 2.3 /100 | #243 | Tragic 5.8% |
| Chickasaw | 2.3 /100 | #244 | Tragic 5.8% |
| Immigrants | Afghanistan | 2.1 /100 | #245 | Tragic 5.8% |
| Immigrants | Venezuela | 1.8 /100 | #246 | Tragic 5.8% |
| Iraqis | 1.4 /100 | #247 | Tragic 5.9% |
| Cree | 1.2 /100 | #248 | Tragic 5.9% |
| Tsimshian | 1.1 /100 | #249 | Tragic 5.9% |
| Immigrants | Eritrea | 1.1 /100 | #250 | Tragic 5.9% |
| Immigrants | Ghana | 1.0 /100 | #251 | Tragic 5.9% |