Carpatho Rusyn vs Immigrants from Oceania Disability
COMPARE
Carpatho Rusyn
Immigrants from Oceania
Disability
Disability Comparison
Carpatho Rusyns
Immigrants from Oceania
12.3%
DISABILITY
1.4/ 100
METRIC RATING
249th/ 347
METRIC RANK
11.8%
DISABILITY
34.3/ 100
METRIC RATING
181st/ 347
METRIC RANK
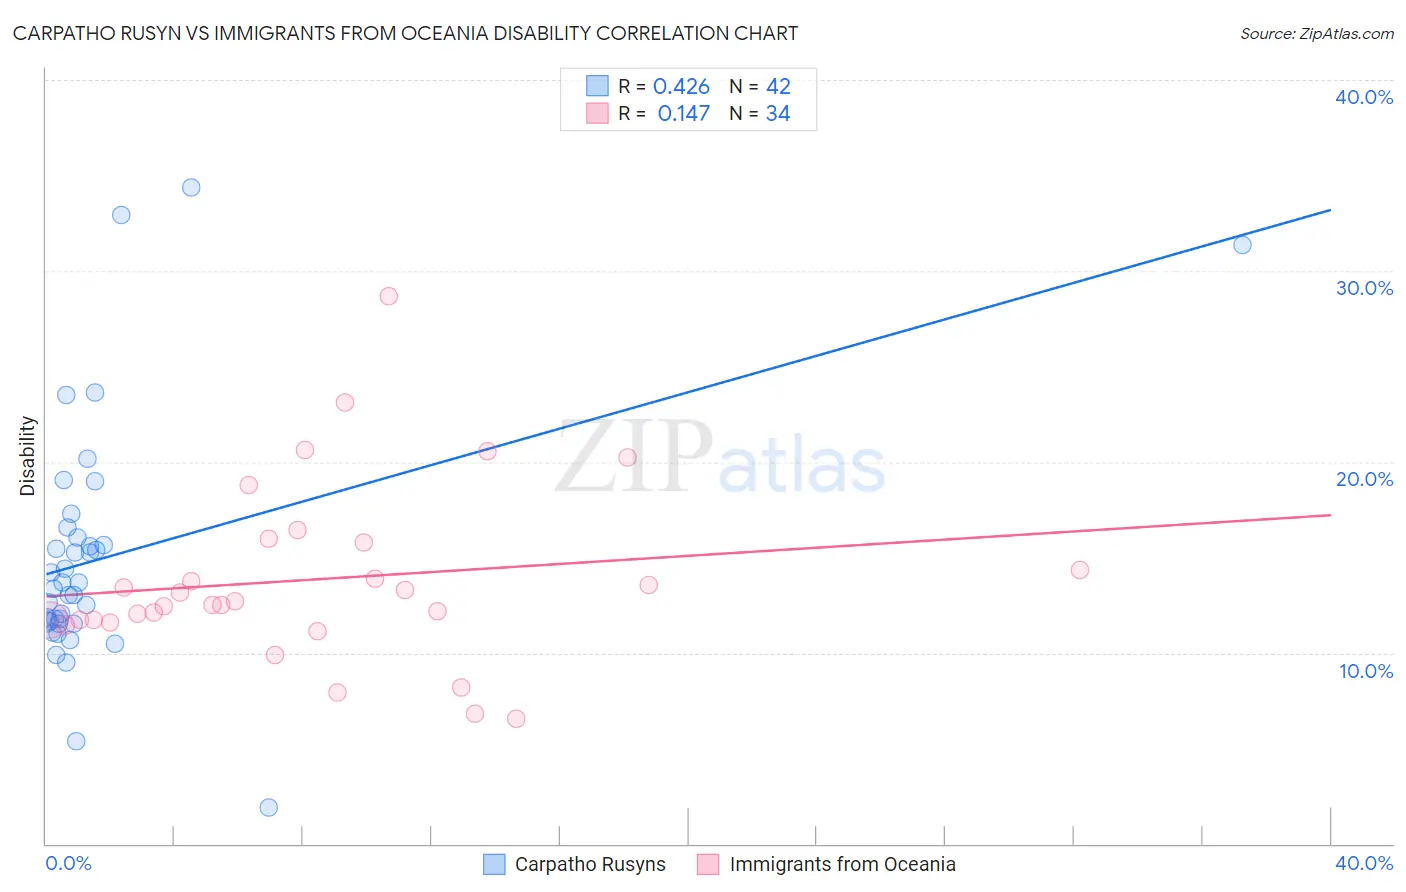
Carpatho Rusyn vs Immigrants from Oceania Disability Correlation Chart
The statistical analysis conducted on geographies consisting of 58,872,415 people shows a moderate positive correlation between the proportion of Carpatho Rusyns and percentage of population with a disability in the United States with a correlation coefficient (R) of 0.426 and weighted average of 12.3%. Similarly, the statistical analysis conducted on geographies consisting of 305,494,892 people shows a poor positive correlation between the proportion of Immigrants from Oceania and percentage of population with a disability in the United States with a correlation coefficient (R) of 0.147 and weighted average of 11.8%, a difference of 4.0%.
Disability Correlation Summary
| Measurement | Carpatho Rusyn | Immigrants from Oceania |
| Minimum | 1.9% | 6.6% |
| Maximum | 34.3% | 28.7% |
| Range | 32.4% | 22.1% |
| Mean | 15.0% | 13.8% |
| Median | 13.5% | 12.6% |
| Interquartile 25% (IQ1) | 11.6% | 11.7% |
| Interquartile 75% (IQ3) | 16.0% | 15.8% |
| Interquartile Range (IQR) | 4.4% | 4.1% |
| Standard Deviation (Sample) | 6.4% | 4.6% |
| Standard Deviation (Population) | 6.3% | 4.6% |
Similar Demographics by Disability
Demographics Similar to Carpatho Rusyns by Disability
In terms of disability, the demographic groups most similar to Carpatho Rusyns are Guamanian/Chamorro (12.3%, a difference of 0.010%), Subsaharan African (12.3%, a difference of 0.010%), European (12.3%, a difference of 0.010%), Indonesian (12.2%, a difference of 0.050%), and Swiss (12.2%, a difference of 0.080%).
| Demographics | Rating | Rank | Disability |
| Poles | 1.7 /100 | #242 | Tragic 12.2% |
| British | 1.5 /100 | #243 | Tragic 12.2% |
| Basques | 1.5 /100 | #244 | Tragic 12.2% |
| Liberians | 1.5 /100 | #245 | Tragic 12.2% |
| Swiss | 1.5 /100 | #246 | Tragic 12.2% |
| Indonesians | 1.4 /100 | #247 | Tragic 12.2% |
| Guamanians/Chamorros | 1.4 /100 | #248 | Tragic 12.3% |
| Carpatho Rusyns | 1.4 /100 | #249 | Tragic 12.3% |
| Sub-Saharan Africans | 1.4 /100 | #250 | Tragic 12.3% |
| Europeans | 1.4 /100 | #251 | Tragic 12.3% |
| Bermudans | 1.1 /100 | #252 | Tragic 12.3% |
| Belgians | 0.8 /100 | #253 | Tragic 12.3% |
| German Russians | 0.8 /100 | #254 | Tragic 12.3% |
| Slovenes | 0.6 /100 | #255 | Tragic 12.4% |
| Immigrants | Dominica | 0.6 /100 | #256 | Tragic 12.4% |
Demographics Similar to Immigrants from Oceania by Disability
In terms of disability, the demographic groups most similar to Immigrants from Oceania are Icelander (11.8%, a difference of 0.010%), Honduran (11.8%, a difference of 0.15%), Immigrants from Honduras (11.8%, a difference of 0.17%), Iraqi (11.8%, a difference of 0.21%), and Immigrants from Burma/Myanmar (11.8%, a difference of 0.30%).
| Demographics | Rating | Rank | Disability |
| Albanians | 50.0 /100 | #174 | Average 11.7% |
| Haitians | 48.6 /100 | #175 | Average 11.7% |
| Immigrants | Western Africa | 47.5 /100 | #176 | Average 11.7% |
| Immigrants | Central America | 46.6 /100 | #177 | Average 11.7% |
| Greeks | 46.2 /100 | #178 | Average 11.7% |
| Immigrants | Armenia | 41.9 /100 | #179 | Average 11.7% |
| Immigrants | Honduras | 37.8 /100 | #180 | Fair 11.8% |
| Immigrants | Oceania | 34.3 /100 | #181 | Fair 11.8% |
| Icelanders | 34.0 /100 | #182 | Fair 11.8% |
| Hondurans | 31.2 /100 | #183 | Fair 11.8% |
| Iraqis | 30.0 /100 | #184 | Fair 11.8% |
| Immigrants | Burma/Myanmar | 28.5 /100 | #185 | Fair 11.8% |
| Immigrants | Scotland | 28.2 /100 | #186 | Fair 11.8% |
| Lebanese | 27.9 /100 | #187 | Fair 11.8% |
| Immigrants | Mexico | 23.8 /100 | #188 | Fair 11.9% |