Carpatho Rusyn vs Immigrants from Oceania Householder Income Ages 25 - 44 years
COMPARE
Carpatho Rusyn
Immigrants from Oceania
Householder Income Ages 25 - 44 years
Householder Income Ages 25 - 44 years Comparison
Carpatho Rusyns
Immigrants from Oceania
$99,449
HOUSEHOLDER INCOME AGES 25 - 44 YEARS
93.7/ 100
METRIC RATING
115th/ 347
METRIC RANK
$97,623
HOUSEHOLDER INCOME AGES 25 - 44 YEARS
84.5/ 100
METRIC RATING
135th/ 347
METRIC RANK
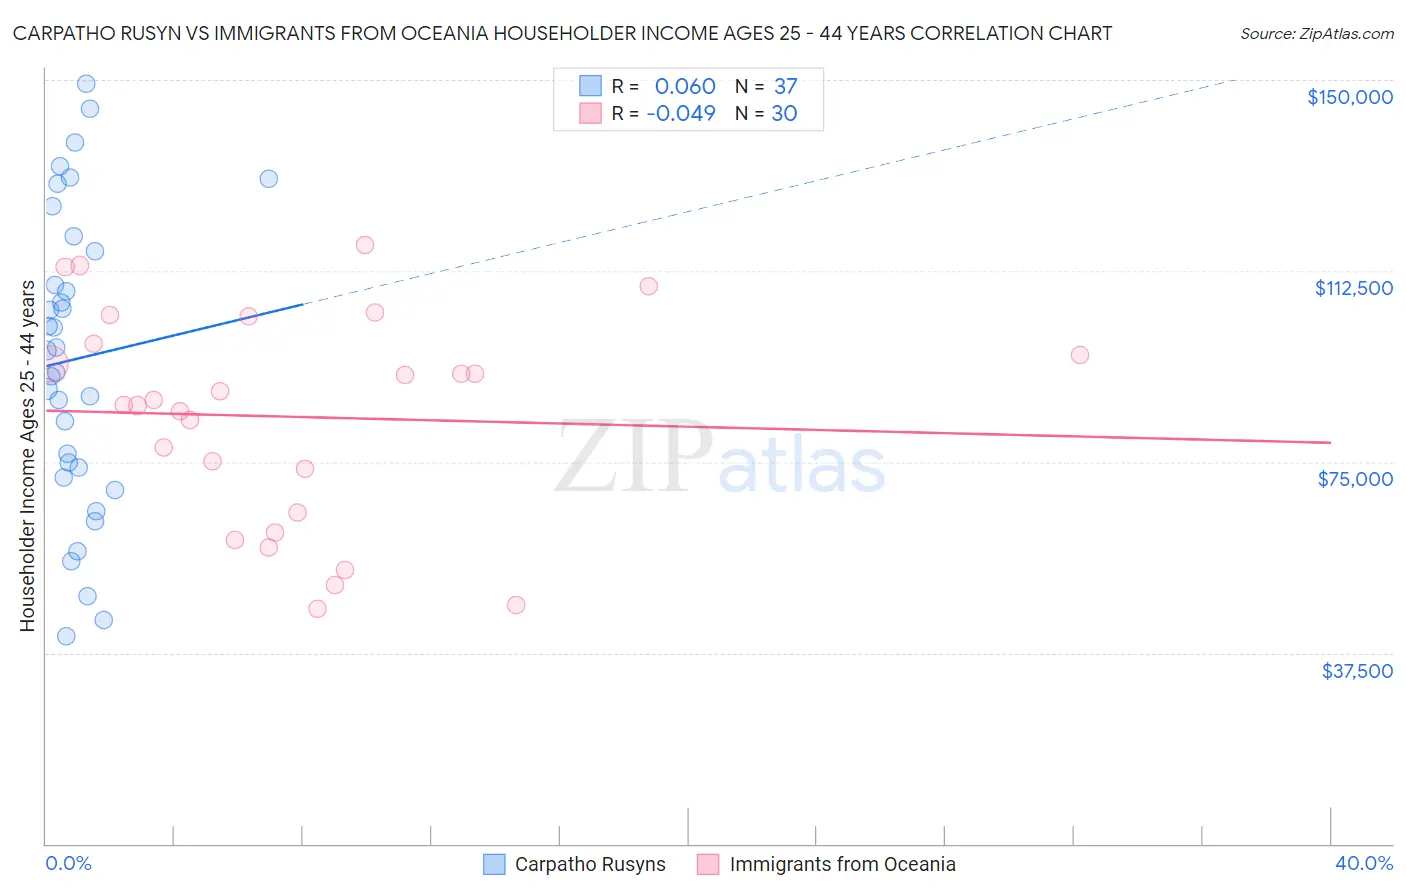
Carpatho Rusyn vs Immigrants from Oceania Householder Income Ages 25 - 44 years Correlation Chart
The statistical analysis conducted on geographies consisting of 58,833,038 people shows a slight positive correlation between the proportion of Carpatho Rusyns and household income with householder between the ages 25 and 44 in the United States with a correlation coefficient (R) of 0.060 and weighted average of $99,449. Similarly, the statistical analysis conducted on geographies consisting of 305,010,299 people shows no correlation between the proportion of Immigrants from Oceania and household income with householder between the ages 25 and 44 in the United States with a correlation coefficient (R) of -0.049 and weighted average of $97,623, a difference of 1.9%.
Householder Income Ages 25 - 44 years Correlation Summary
| Measurement | Carpatho Rusyn | Immigrants from Oceania |
| Minimum | $40,789 | $46,211 |
| Maximum | $149,241 | $117,593 |
| Range | $108,452 | $71,381 |
| Mean | $95,167 | $83,848 |
| Median | $96,892 | $86,701 |
| Interquartile 25% (IQ1) | $72,857 | $65,112 |
| Interquartile 75% (IQ3) | $117,797 | $98,105 |
| Interquartile Range (IQR) | $44,941 | $32,993 |
| Standard Deviation (Sample) | $29,061 | $20,832 |
| Standard Deviation (Population) | $28,665 | $20,482 |
Demographics Similar to Carpatho Rusyns and Immigrants from Oceania by Householder Income Ages 25 - 44 years
In terms of householder income ages 25 - 44 years, the demographic groups most similar to Carpatho Rusyns are Portuguese ($99,429, a difference of 0.020%), Immigrants from Northern Africa ($99,232, a difference of 0.22%), Syrian ($99,215, a difference of 0.24%), Jordanian ($99,186, a difference of 0.27%), and Swedish ($99,136, a difference of 0.32%). Similarly, the demographic groups most similar to Immigrants from Oceania are Canadian ($97,625, a difference of 0.0%), Tsimshian ($97,809, a difference of 0.19%), Immigrants from Zimbabwe ($97,880, a difference of 0.26%), Immigrants from Albania ($97,929, a difference of 0.31%), and Immigrants from Kuwait ($98,122, a difference of 0.51%).
| Demographics | Rating | Rank | Householder Income Ages 25 - 44 years |
| Carpatho Rusyns | 93.7 /100 | #115 | Exceptional $99,449 |
| Portuguese | 93.7 /100 | #116 | Exceptional $99,429 |
| Immigrants | Northern Africa | 93.0 /100 | #117 | Exceptional $99,232 |
| Syrians | 92.9 /100 | #118 | Exceptional $99,215 |
| Jordanians | 92.8 /100 | #119 | Exceptional $99,186 |
| Swedes | 92.7 /100 | #120 | Exceptional $99,136 |
| Peruvians | 91.7 /100 | #121 | Exceptional $98,886 |
| Immigrants | Uzbekistan | 91.5 /100 | #122 | Exceptional $98,849 |
| Palestinians | 91.2 /100 | #123 | Exceptional $98,777 |
| Zimbabweans | 90.3 /100 | #124 | Exceptional $98,586 |
| Pakistanis | 89.3 /100 | #125 | Excellent $98,401 |
| British | 89.1 /100 | #126 | Excellent $98,359 |
| Serbians | 88.9 /100 | #127 | Excellent $98,320 |
| Europeans | 88.9 /100 | #128 | Excellent $98,310 |
| Brazilians | 88.6 /100 | #129 | Excellent $98,267 |
| Immigrants | Kuwait | 87.8 /100 | #130 | Excellent $98,122 |
| Immigrants | Albania | 86.6 /100 | #131 | Excellent $97,929 |
| Immigrants | Zimbabwe | 86.3 /100 | #132 | Excellent $97,880 |
| Tsimshian | 85.8 /100 | #133 | Excellent $97,809 |
| Canadians | 84.5 /100 | #134 | Excellent $97,625 |
| Immigrants | Oceania | 84.5 /100 | #135 | Excellent $97,623 |