Carpatho Rusyn vs Immigrants from Dominica Family Poverty
COMPARE
Carpatho Rusyn
Immigrants from Dominica
Family Poverty
Family Poverty Comparison
Carpatho Rusyns
Immigrants from Dominica
7.5%
FAMILY POVERTY
99.3/ 100
METRIC RATING
39th/ 347
METRIC RANK
12.7%
FAMILY POVERTY
0.0/ 100
METRIC RATING
324th/ 347
METRIC RANK
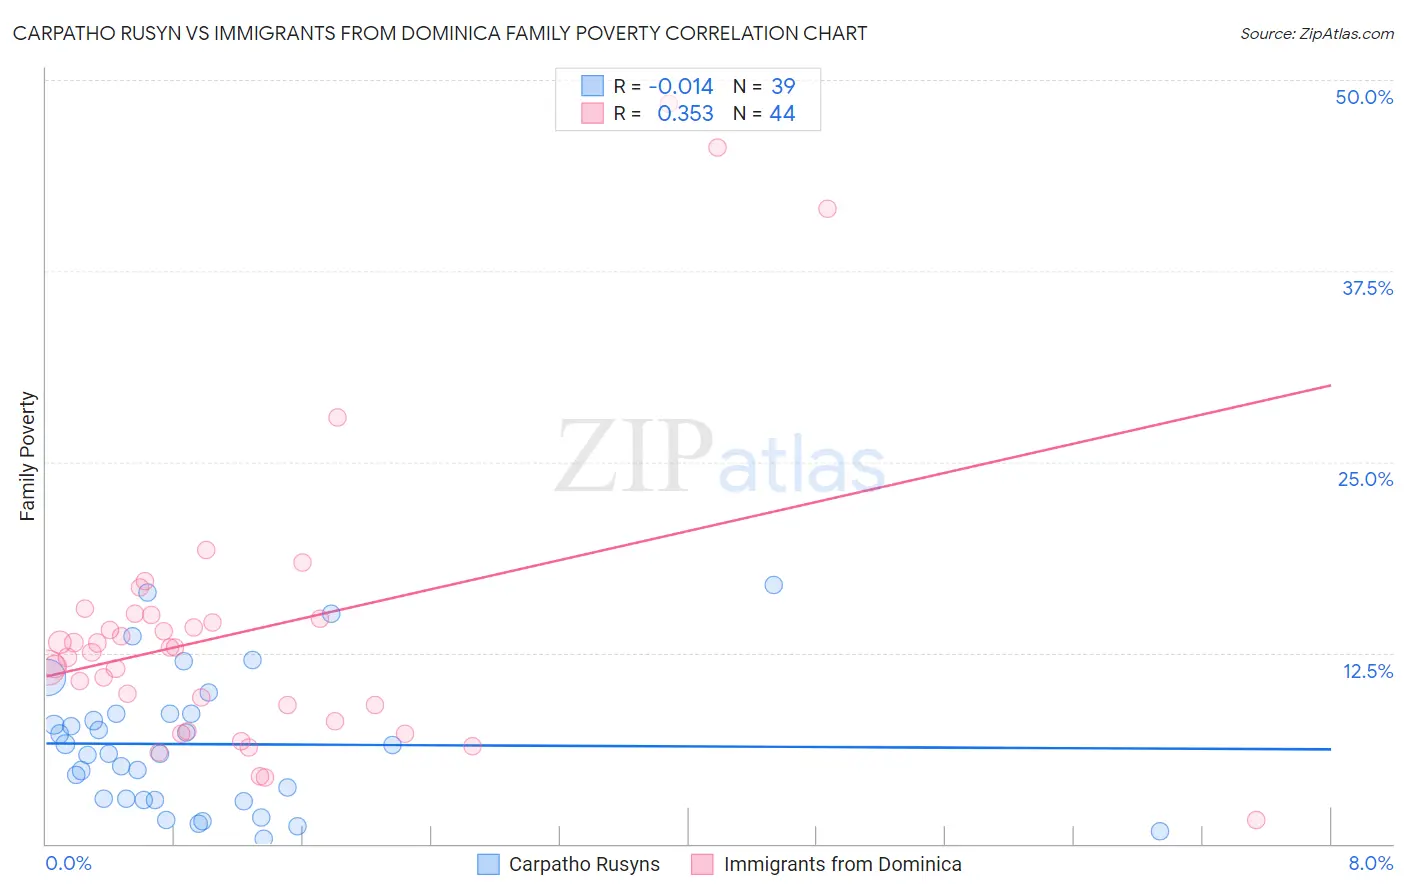
Carpatho Rusyn vs Immigrants from Dominica Family Poverty Correlation Chart
The statistical analysis conducted on geographies consisting of 58,816,515 people shows no correlation between the proportion of Carpatho Rusyns and poverty level among families in the United States with a correlation coefficient (R) of -0.014 and weighted average of 7.5%. Similarly, the statistical analysis conducted on geographies consisting of 83,762,031 people shows a mild positive correlation between the proportion of Immigrants from Dominica and poverty level among families in the United States with a correlation coefficient (R) of 0.353 and weighted average of 12.7%, a difference of 68.9%.
Family Poverty Correlation Summary
| Measurement | Carpatho Rusyn | Immigrants from Dominica |
| Minimum | 0.31% | 1.5% |
| Maximum | 16.9% | 48.5% |
| Range | 16.6% | 47.0% |
| Mean | 6.5% | 14.0% |
| Median | 5.9% | 12.7% |
| Interquartile 25% (IQ1) | 2.9% | 8.5% |
| Interquartile 75% (IQ3) | 8.5% | 14.9% |
| Interquartile Range (IQR) | 5.6% | 6.3% |
| Standard Deviation (Sample) | 4.4% | 9.8% |
| Standard Deviation (Population) | 4.3% | 9.6% |
Similar Demographics by Family Poverty
Demographics Similar to Carpatho Rusyns by Family Poverty
In terms of family poverty, the demographic groups most similar to Carpatho Rusyns are Slovene (7.5%, a difference of 0.040%), Bolivian (7.5%, a difference of 0.060%), Estonian (7.5%, a difference of 0.31%), Immigrants from Australia (7.6%, a difference of 0.34%), and Turkish (7.5%, a difference of 0.47%).
| Demographics | Rating | Rank | Family Poverty |
| Poles | 99.5 /100 | #32 | Exceptional 7.4% |
| Immigrants | Japan | 99.5 /100 | #33 | Exceptional 7.4% |
| Russians | 99.5 /100 | #34 | Exceptional 7.5% |
| Greeks | 99.4 /100 | #35 | Exceptional 7.5% |
| Turks | 99.4 /100 | #36 | Exceptional 7.5% |
| Estonians | 99.4 /100 | #37 | Exceptional 7.5% |
| Bolivians | 99.3 /100 | #38 | Exceptional 7.5% |
| Carpatho Rusyns | 99.3 /100 | #39 | Exceptional 7.5% |
| Slovenes | 99.3 /100 | #40 | Exceptional 7.5% |
| Immigrants | Australia | 99.2 /100 | #41 | Exceptional 7.6% |
| Scandinavians | 99.1 /100 | #42 | Exceptional 7.6% |
| Immigrants | Austria | 99.1 /100 | #43 | Exceptional 7.6% |
| Germans | 99.0 /100 | #44 | Exceptional 7.7% |
| Okinawans | 98.9 /100 | #45 | Exceptional 7.7% |
| Tongans | 98.9 /100 | #46 | Exceptional 7.7% |
Demographics Similar to Immigrants from Dominica by Family Poverty
In terms of family poverty, the demographic groups most similar to Immigrants from Dominica are Menominee (12.7%, a difference of 0.080%), Immigrants from Honduras (12.7%, a difference of 0.62%), Arapaho (12.7%, a difference of 0.72%), Paiute (13.0%, a difference of 2.0%), and Colville (13.0%, a difference of 2.0%).
| Demographics | Rating | Rank | Family Poverty |
| Immigrants | Grenada | 0.0 /100 | #317 | Tragic 12.4% |
| U.S. Virgin Islanders | 0.0 /100 | #318 | Tragic 12.4% |
| British West Indians | 0.0 /100 | #319 | Tragic 12.4% |
| Inupiat | 0.0 /100 | #320 | Tragic 12.5% |
| Arapaho | 0.0 /100 | #321 | Tragic 12.7% |
| Immigrants | Honduras | 0.0 /100 | #322 | Tragic 12.7% |
| Menominee | 0.0 /100 | #323 | Tragic 12.7% |
| Immigrants | Dominica | 0.0 /100 | #324 | Tragic 12.7% |
| Paiute | 0.0 /100 | #325 | Tragic 13.0% |
| Colville | 0.0 /100 | #326 | Tragic 13.0% |
| Yakama | 0.0 /100 | #327 | Tragic 13.1% |
| Central American Indians | 0.0 /100 | #328 | Tragic 13.3% |
| Blacks/African Americans | 0.0 /100 | #329 | Tragic 13.3% |
| Natives/Alaskans | 0.0 /100 | #330 | Tragic 14.3% |
| Cheyenne | 0.0 /100 | #331 | Tragic 14.3% |