Burmese vs Chickasaw Male Poverty
COMPARE
Burmese
Chickasaw
Male Poverty
Male Poverty Comparison
Burmese
Chickasaw
9.7%
MALE POVERTY
99.6/ 100
METRIC RATING
26th/ 347
METRIC RANK
13.5%
MALE POVERTY
0.0/ 100
METRIC RATING
273rd/ 347
METRIC RANK
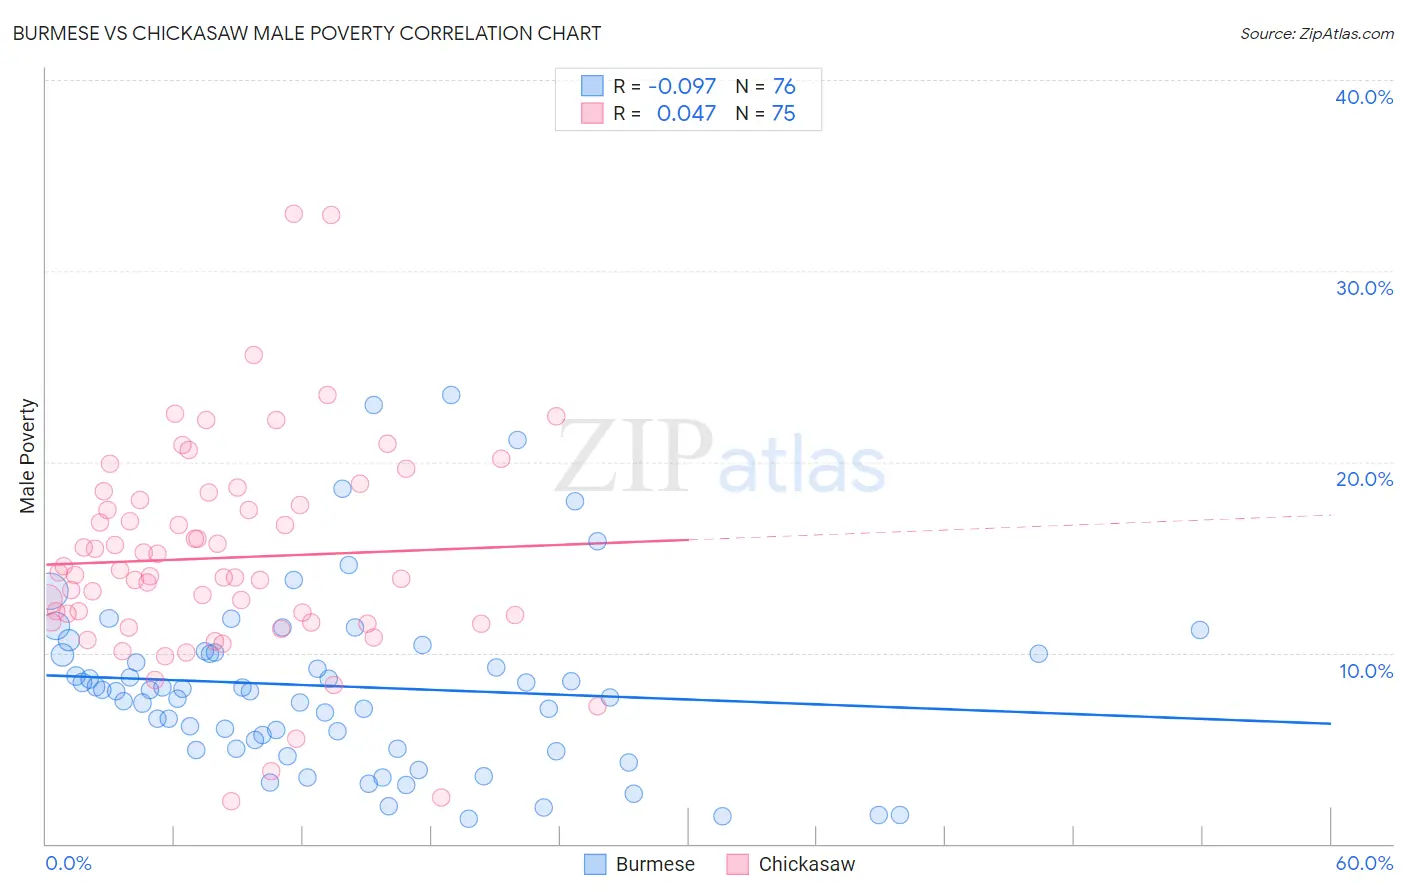
Burmese vs Chickasaw Male Poverty Correlation Chart
The statistical analysis conducted on geographies consisting of 464,653,022 people shows a slight negative correlation between the proportion of Burmese and poverty level among males in the United States with a correlation coefficient (R) of -0.097 and weighted average of 9.7%. Similarly, the statistical analysis conducted on geographies consisting of 147,660,855 people shows no correlation between the proportion of Chickasaw and poverty level among males in the United States with a correlation coefficient (R) of 0.047 and weighted average of 13.5%, a difference of 39.3%.
Male Poverty Correlation Summary
| Measurement | Burmese | Chickasaw |
| Minimum | 1.3% | 2.2% |
| Maximum | 23.5% | 33.0% |
| Range | 22.2% | 30.8% |
| Mean | 8.2% | 15.0% |
| Median | 8.0% | 14.0% |
| Interquartile 25% (IQ1) | 5.0% | 11.6% |
| Interquartile 75% (IQ3) | 10.0% | 18.0% |
| Interquartile Range (IQR) | 5.1% | 6.4% |
| Standard Deviation (Sample) | 4.7% | 5.6% |
| Standard Deviation (Population) | 4.7% | 5.5% |
Similar Demographics by Male Poverty
Demographics Similar to Burmese by Male Poverty
In terms of male poverty, the demographic groups most similar to Burmese are Danish (9.7%, a difference of 0.13%), Immigrants from Korea (9.7%, a difference of 0.21%), Greek (9.7%, a difference of 0.25%), Polish (9.7%, a difference of 0.33%), and Tongan (9.7%, a difference of 0.35%).
| Demographics | Rating | Rank | Male Poverty |
| Immigrants | Hong Kong | 99.7 /100 | #19 | Exceptional 9.6% |
| Latvians | 99.7 /100 | #20 | Exceptional 9.6% |
| Immigrants | Scotland | 99.7 /100 | #21 | Exceptional 9.6% |
| Croatians | 99.7 /100 | #22 | Exceptional 9.6% |
| Italians | 99.7 /100 | #23 | Exceptional 9.6% |
| Swedes | 99.7 /100 | #24 | Exceptional 9.6% |
| Eastern Europeans | 99.6 /100 | #25 | Exceptional 9.6% |
| Burmese | 99.6 /100 | #26 | Exceptional 9.7% |
| Danes | 99.6 /100 | #27 | Exceptional 9.7% |
| Immigrants | Korea | 99.6 /100 | #28 | Exceptional 9.7% |
| Greeks | 99.6 /100 | #29 | Exceptional 9.7% |
| Poles | 99.5 /100 | #30 | Exceptional 9.7% |
| Tongans | 99.5 /100 | #31 | Exceptional 9.7% |
| Macedonians | 99.5 /100 | #32 | Exceptional 9.7% |
| Immigrants | Northern Europe | 99.5 /100 | #33 | Exceptional 9.7% |
Demographics Similar to Chickasaw by Male Poverty
In terms of male poverty, the demographic groups most similar to Chickasaw are Immigrants from West Indies (13.5%, a difference of 0.070%), Immigrants from Bahamas (13.5%, a difference of 0.29%), Barbadian (13.6%, a difference of 0.70%), Immigrants from Latin America (13.6%, a difference of 0.89%), and Bangladeshi (13.6%, a difference of 1.0%).
| Demographics | Rating | Rank | Male Poverty |
| Immigrants | Guyana | 0.1 /100 | #266 | Tragic 13.2% |
| Immigrants | Jamaica | 0.1 /100 | #267 | Tragic 13.3% |
| Sub-Saharan Africans | 0.1 /100 | #268 | Tragic 13.3% |
| Guyanese | 0.0 /100 | #269 | Tragic 13.3% |
| Cree | 0.0 /100 | #270 | Tragic 13.3% |
| Spanish Americans | 0.0 /100 | #271 | Tragic 13.4% |
| Immigrants | Bahamas | 0.0 /100 | #272 | Tragic 13.5% |
| Chickasaw | 0.0 /100 | #273 | Tragic 13.5% |
| Immigrants | West Indies | 0.0 /100 | #274 | Tragic 13.5% |
| Barbadians | 0.0 /100 | #275 | Tragic 13.6% |
| Immigrants | Latin America | 0.0 /100 | #276 | Tragic 13.6% |
| Bangladeshis | 0.0 /100 | #277 | Tragic 13.6% |
| Belizeans | 0.0 /100 | #278 | Tragic 13.6% |
| Haitians | 0.0 /100 | #279 | Tragic 13.7% |
| Mexicans | 0.0 /100 | #280 | Tragic 13.7% |