Burmese vs Immigrants from Sri Lanka Male Poverty
COMPARE
Burmese
Immigrants from Sri Lanka
Male Poverty
Male Poverty Comparison
Burmese
Immigrants from Sri Lanka
9.7%
MALE POVERTY
99.6/ 100
METRIC RATING
26th/ 347
METRIC RANK
10.2%
MALE POVERTY
97.2/ 100
METRIC RATING
68th/ 347
METRIC RANK
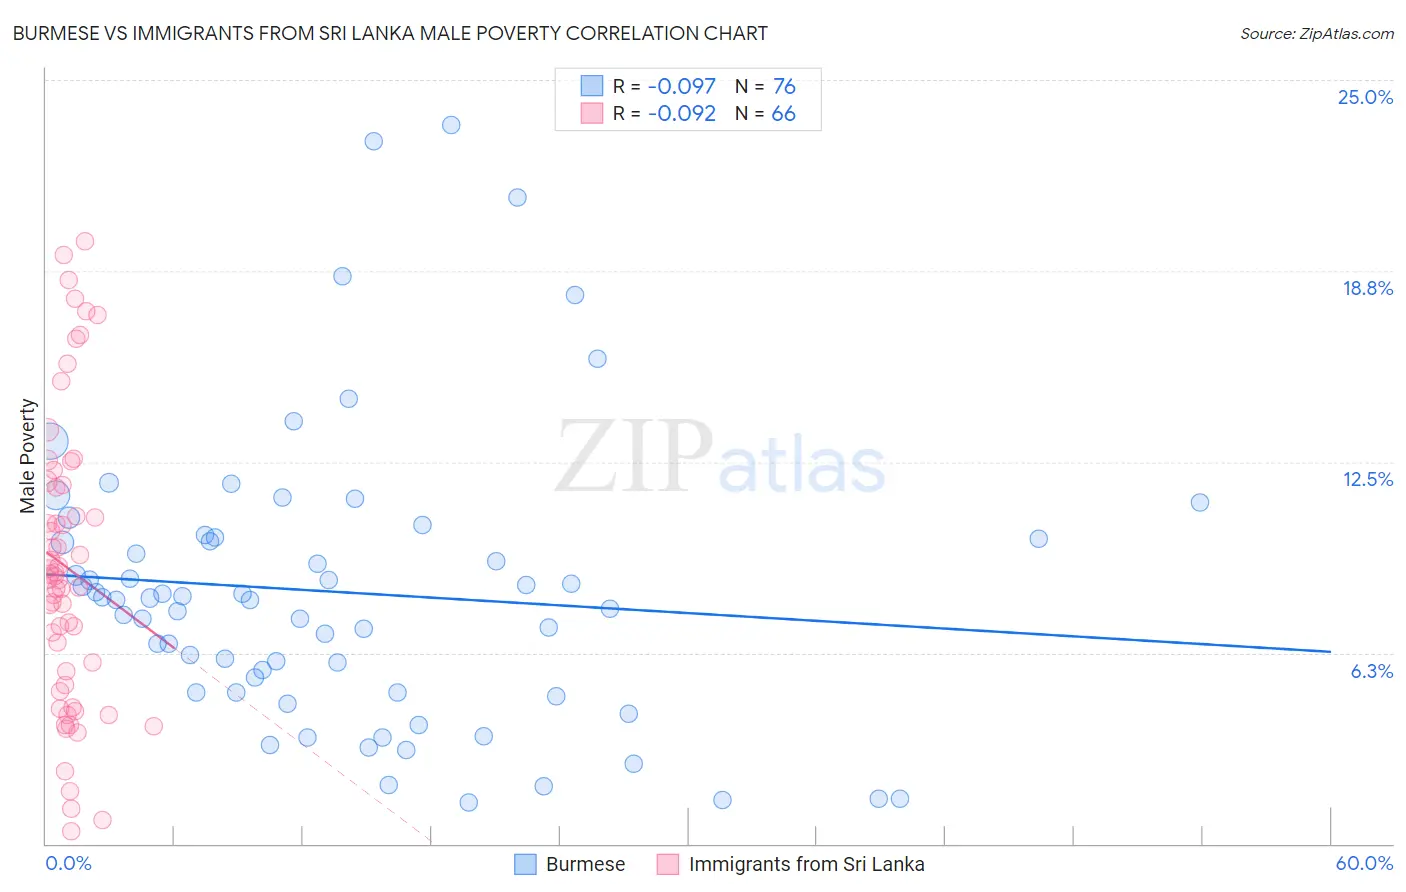
Burmese vs Immigrants from Sri Lanka Male Poverty Correlation Chart
The statistical analysis conducted on geographies consisting of 464,653,022 people shows a slight negative correlation between the proportion of Burmese and poverty level among males in the United States with a correlation coefficient (R) of -0.097 and weighted average of 9.7%. Similarly, the statistical analysis conducted on geographies consisting of 149,670,593 people shows a slight negative correlation between the proportion of Immigrants from Sri Lanka and poverty level among males in the United States with a correlation coefficient (R) of -0.092 and weighted average of 10.2%, a difference of 5.5%.
Male Poverty Correlation Summary
| Measurement | Burmese | Immigrants from Sri Lanka |
| Minimum | 1.3% | 0.43% |
| Maximum | 23.5% | 19.7% |
| Range | 22.2% | 19.3% |
| Mean | 8.2% | 9.0% |
| Median | 8.0% | 8.7% |
| Interquartile 25% (IQ1) | 5.0% | 5.2% |
| Interquartile 75% (IQ3) | 10.0% | 11.8% |
| Interquartile Range (IQR) | 5.1% | 6.6% |
| Standard Deviation (Sample) | 4.7% | 4.7% |
| Standard Deviation (Population) | 4.7% | 4.7% |
Similar Demographics by Male Poverty
Demographics Similar to Burmese by Male Poverty
In terms of male poverty, the demographic groups most similar to Burmese are Danish (9.7%, a difference of 0.13%), Immigrants from Korea (9.7%, a difference of 0.21%), Greek (9.7%, a difference of 0.25%), Polish (9.7%, a difference of 0.33%), and Tongan (9.7%, a difference of 0.35%).
| Demographics | Rating | Rank | Male Poverty |
| Immigrants | Hong Kong | 99.7 /100 | #19 | Exceptional 9.6% |
| Latvians | 99.7 /100 | #20 | Exceptional 9.6% |
| Immigrants | Scotland | 99.7 /100 | #21 | Exceptional 9.6% |
| Croatians | 99.7 /100 | #22 | Exceptional 9.6% |
| Italians | 99.7 /100 | #23 | Exceptional 9.6% |
| Swedes | 99.7 /100 | #24 | Exceptional 9.6% |
| Eastern Europeans | 99.6 /100 | #25 | Exceptional 9.6% |
| Burmese | 99.6 /100 | #26 | Exceptional 9.7% |
| Danes | 99.6 /100 | #27 | Exceptional 9.7% |
| Immigrants | Korea | 99.6 /100 | #28 | Exceptional 9.7% |
| Greeks | 99.6 /100 | #29 | Exceptional 9.7% |
| Poles | 99.5 /100 | #30 | Exceptional 9.7% |
| Tongans | 99.5 /100 | #31 | Exceptional 9.7% |
| Macedonians | 99.5 /100 | #32 | Exceptional 9.7% |
| Immigrants | Northern Europe | 99.5 /100 | #33 | Exceptional 9.7% |
Demographics Similar to Immigrants from Sri Lanka by Male Poverty
In terms of male poverty, the demographic groups most similar to Immigrants from Sri Lanka are Immigrants from Netherlands (10.2%, a difference of 0.050%), Immigrants from Australia (10.2%, a difference of 0.13%), Paraguayan (10.2%, a difference of 0.15%), European (10.2%, a difference of 0.18%), and Immigrants from Canada (10.2%, a difference of 0.18%).
| Demographics | Rating | Rank | Male Poverty |
| Austrians | 97.8 /100 | #61 | Exceptional 10.1% |
| Immigrants | Italy | 97.8 /100 | #62 | Exceptional 10.2% |
| Slovaks | 97.7 /100 | #63 | Exceptional 10.2% |
| Swiss | 97.5 /100 | #64 | Exceptional 10.2% |
| Zimbabweans | 97.5 /100 | #65 | Exceptional 10.2% |
| Serbians | 97.5 /100 | #66 | Exceptional 10.2% |
| Immigrants | Netherlands | 97.3 /100 | #67 | Exceptional 10.2% |
| Immigrants | Sri Lanka | 97.2 /100 | #68 | Exceptional 10.2% |
| Immigrants | Australia | 97.1 /100 | #69 | Exceptional 10.2% |
| Paraguayans | 97.1 /100 | #70 | Exceptional 10.2% |
| Europeans | 97.1 /100 | #71 | Exceptional 10.2% |
| Immigrants | Canada | 97.1 /100 | #72 | Exceptional 10.2% |
| Immigrants | Asia | 97.0 /100 | #73 | Exceptional 10.2% |
| Immigrants | Eastern Europe | 96.9 /100 | #74 | Exceptional 10.2% |
| Carpatho Rusyns | 96.9 /100 | #75 | Exceptional 10.2% |