Burmese vs Maltese Male Poverty
COMPARE
Burmese
Maltese
Male Poverty
Male Poverty Comparison
Burmese
Maltese
9.7%
MALE POVERTY
99.6/ 100
METRIC RATING
26th/ 347
METRIC RANK
9.1%
MALE POVERTY
100.0/ 100
METRIC RATING
5th/ 347
METRIC RANK
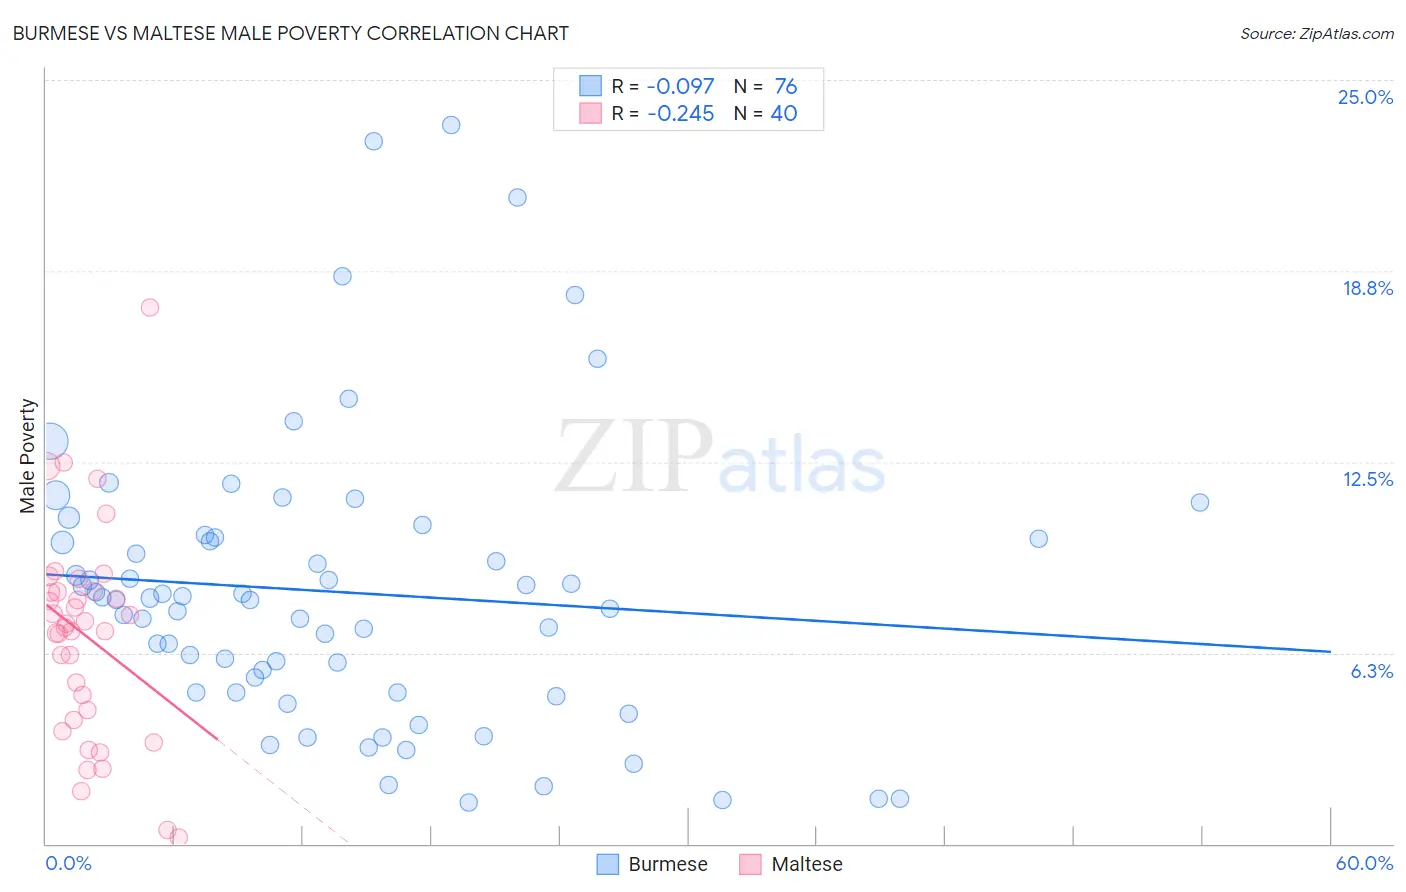
Burmese vs Maltese Male Poverty Correlation Chart
The statistical analysis conducted on geographies consisting of 464,653,022 people shows a slight negative correlation between the proportion of Burmese and poverty level among males in the United States with a correlation coefficient (R) of -0.097 and weighted average of 9.7%. Similarly, the statistical analysis conducted on geographies consisting of 126,413,393 people shows a weak negative correlation between the proportion of Maltese and poverty level among males in the United States with a correlation coefficient (R) of -0.245 and weighted average of 9.1%, a difference of 6.7%.
Male Poverty Correlation Summary
| Measurement | Burmese | Maltese |
| Minimum | 1.3% | 0.22% |
| Maximum | 23.5% | 17.6% |
| Range | 22.2% | 17.3% |
| Mean | 8.2% | 6.8% |
| Median | 8.0% | 7.1% |
| Interquartile 25% (IQ1) | 5.0% | 4.2% |
| Interquartile 75% (IQ3) | 10.0% | 8.3% |
| Interquartile Range (IQR) | 5.1% | 4.1% |
| Standard Deviation (Sample) | 4.7% | 3.5% |
| Standard Deviation (Population) | 4.7% | 3.4% |
Similar Demographics by Male Poverty
Demographics Similar to Burmese by Male Poverty
In terms of male poverty, the demographic groups most similar to Burmese are Danish (9.7%, a difference of 0.13%), Immigrants from Korea (9.7%, a difference of 0.21%), Greek (9.7%, a difference of 0.25%), Polish (9.7%, a difference of 0.33%), and Tongan (9.7%, a difference of 0.35%).
| Demographics | Rating | Rank | Male Poverty |
| Immigrants | Hong Kong | 99.7 /100 | #19 | Exceptional 9.6% |
| Latvians | 99.7 /100 | #20 | Exceptional 9.6% |
| Immigrants | Scotland | 99.7 /100 | #21 | Exceptional 9.6% |
| Croatians | 99.7 /100 | #22 | Exceptional 9.6% |
| Italians | 99.7 /100 | #23 | Exceptional 9.6% |
| Swedes | 99.7 /100 | #24 | Exceptional 9.6% |
| Eastern Europeans | 99.6 /100 | #25 | Exceptional 9.6% |
| Burmese | 99.6 /100 | #26 | Exceptional 9.7% |
| Danes | 99.6 /100 | #27 | Exceptional 9.7% |
| Immigrants | Korea | 99.6 /100 | #28 | Exceptional 9.7% |
| Greeks | 99.6 /100 | #29 | Exceptional 9.7% |
| Poles | 99.5 /100 | #30 | Exceptional 9.7% |
| Tongans | 99.5 /100 | #31 | Exceptional 9.7% |
| Macedonians | 99.5 /100 | #32 | Exceptional 9.7% |
| Immigrants | Northern Europe | 99.5 /100 | #33 | Exceptional 9.7% |
Demographics Similar to Maltese by Male Poverty
In terms of male poverty, the demographic groups most similar to Maltese are Assyrian/Chaldean/Syriac (9.1%, a difference of 0.66%), Immigrants from Ireland (9.1%, a difference of 0.75%), Filipino (9.2%, a difference of 1.4%), Immigrants from Taiwan (8.9%, a difference of 2.0%), and Immigrants from South Central Asia (9.3%, a difference of 2.2%).
| Demographics | Rating | Rank | Male Poverty |
| Immigrants | India | 100.0 /100 | #1 | Exceptional 8.2% |
| Chinese | 100.0 /100 | #2 | Exceptional 8.7% |
| Thais | 100.0 /100 | #3 | Exceptional 8.7% |
| Immigrants | Taiwan | 100.0 /100 | #4 | Exceptional 8.9% |
| Maltese | 100.0 /100 | #5 | Exceptional 9.1% |
| Assyrians/Chaldeans/Syriacs | 99.9 /100 | #6 | Exceptional 9.1% |
| Immigrants | Ireland | 99.9 /100 | #7 | Exceptional 9.1% |
| Filipinos | 99.9 /100 | #8 | Exceptional 9.2% |
| Immigrants | South Central Asia | 99.9 /100 | #9 | Exceptional 9.3% |
| Bulgarians | 99.9 /100 | #10 | Exceptional 9.3% |
| Bolivians | 99.9 /100 | #11 | Exceptional 9.4% |
| Immigrants | Bolivia | 99.9 /100 | #12 | Exceptional 9.4% |
| Immigrants | Lithuania | 99.9 /100 | #13 | Exceptional 9.4% |
| Immigrants | North Macedonia | 99.8 /100 | #14 | Exceptional 9.4% |
| Bhutanese | 99.8 /100 | #15 | Exceptional 9.5% |