Bolivian vs Trinidadian and Tobagonian 7th Grade
COMPARE
Bolivian
Trinidadian and Tobagonian
7th Grade
7th Grade Comparison
Bolivians
Trinidadians and Tobagonians
95.4%
7TH GRADE
1.1/ 100
METRIC RATING
249th/ 347
METRIC RANK
95.2%
7TH GRADE
0.3/ 100
METRIC RATING
269th/ 347
METRIC RANK
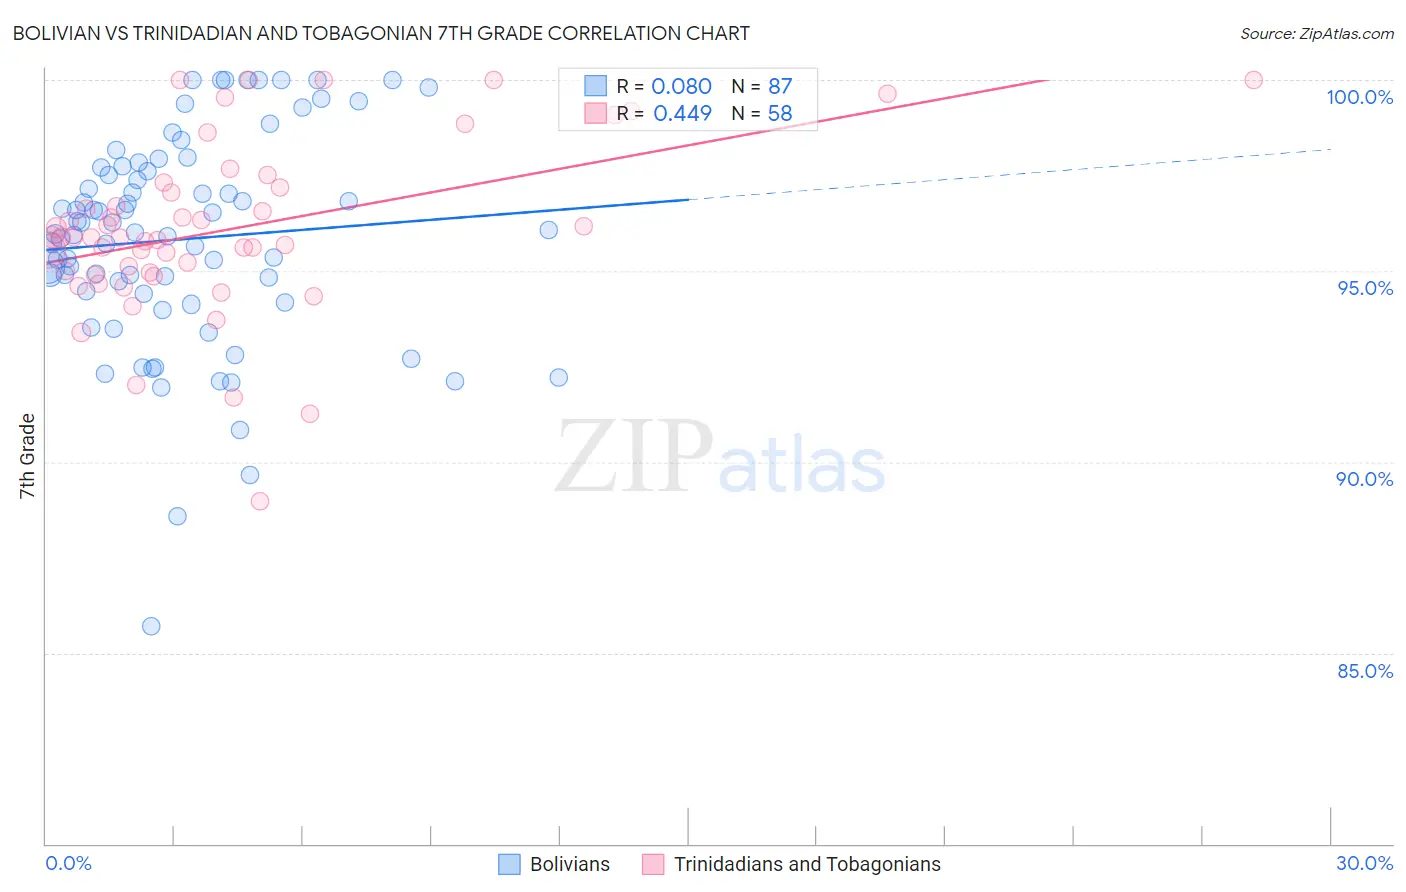
Bolivian vs Trinidadian and Tobagonian 7th Grade Correlation Chart
The statistical analysis conducted on geographies consisting of 184,666,822 people shows a slight positive correlation between the proportion of Bolivians and percentage of population with at least 7th grade education in the United States with a correlation coefficient (R) of 0.080 and weighted average of 95.4%. Similarly, the statistical analysis conducted on geographies consisting of 219,881,170 people shows a moderate positive correlation between the proportion of Trinidadians and Tobagonians and percentage of population with at least 7th grade education in the United States with a correlation coefficient (R) of 0.449 and weighted average of 95.2%, a difference of 0.23%.
7th Grade Correlation Summary
| Measurement | Bolivian | Trinidadian and Tobagonian |
| Minimum | 85.7% | 89.0% |
| Maximum | 100.0% | 100.0% |
| Range | 14.3% | 11.0% |
| Mean | 95.8% | 96.1% |
| Median | 96.0% | 95.9% |
| Interquartile 25% (IQ1) | 94.4% | 95.0% |
| Interquartile 75% (IQ3) | 97.7% | 97.2% |
| Interquartile Range (IQR) | 3.3% | 2.2% |
| Standard Deviation (Sample) | 2.8% | 2.3% |
| Standard Deviation (Population) | 2.8% | 2.2% |
Demographics Similar to Bolivians and Trinidadians and Tobagonians by 7th Grade
In terms of 7th grade, the demographic groups most similar to Bolivians are Immigrants from Cameroon (95.4%, a difference of 0.020%), Immigrants from Jamaica (95.4%, a difference of 0.020%), Immigrants from Ethiopia (95.3%, a difference of 0.030%), Somali (95.3%, a difference of 0.030%), and Colombian (95.3%, a difference of 0.040%). Similarly, the demographic groups most similar to Trinidadians and Tobagonians are Immigrants from Hong Kong (95.2%, a difference of 0.020%), Yuman (95.2%, a difference of 0.030%), Immigrants from Ghana (95.2%, a difference of 0.040%), Immigrants from Uruguay (95.2%, a difference of 0.050%), and Immigrants from Nigeria (95.2%, a difference of 0.080%).
| Demographics | Rating | Rank | 7th Grade |
| Bolivians | 1.1 /100 | #249 | Tragic 95.4% |
| Immigrants | Cameroon | 0.9 /100 | #250 | Tragic 95.4% |
| Immigrants | Jamaica | 0.9 /100 | #251 | Tragic 95.4% |
| Immigrants | Ethiopia | 0.9 /100 | #252 | Tragic 95.3% |
| Somalis | 0.9 /100 | #253 | Tragic 95.3% |
| Colombians | 0.8 /100 | #254 | Tragic 95.3% |
| Koreans | 0.8 /100 | #255 | Tragic 95.3% |
| Immigrants | China | 0.7 /100 | #256 | Tragic 95.3% |
| Immigrants | Congo | 0.7 /100 | #257 | Tragic 95.3% |
| Ghanaians | 0.7 /100 | #258 | Tragic 95.3% |
| Immigrants | Costa Rica | 0.6 /100 | #259 | Tragic 95.3% |
| Afghans | 0.5 /100 | #260 | Tragic 95.3% |
| South Americans | 0.5 /100 | #261 | Tragic 95.2% |
| Immigrants | Somalia | 0.5 /100 | #262 | Tragic 95.2% |
| West Indians | 0.5 /100 | #263 | Tragic 95.2% |
| Immigrants | Nigeria | 0.4 /100 | #264 | Tragic 95.2% |
| Immigrants | Uruguay | 0.3 /100 | #265 | Tragic 95.2% |
| Immigrants | Ghana | 0.3 /100 | #266 | Tragic 95.2% |
| Yuman | 0.3 /100 | #267 | Tragic 95.2% |
| Immigrants | Hong Kong | 0.3 /100 | #268 | Tragic 95.2% |
| Trinidadians and Tobagonians | 0.3 /100 | #269 | Tragic 95.2% |