Asian vs Central American Married-Couple Family Poverty
COMPARE
Asian
Central American
Married-Couple Family Poverty
Married-Couple Family Poverty Comparison
Asians
Central Americans
4.7%
MARRIED-COUPLE FAMILY POVERTY
97.6/ 100
METRIC RATING
102nd/ 347
METRIC RANK
6.7%
MARRIED-COUPLE FAMILY POVERTY
0.0/ 100
METRIC RATING
301st/ 347
METRIC RANK
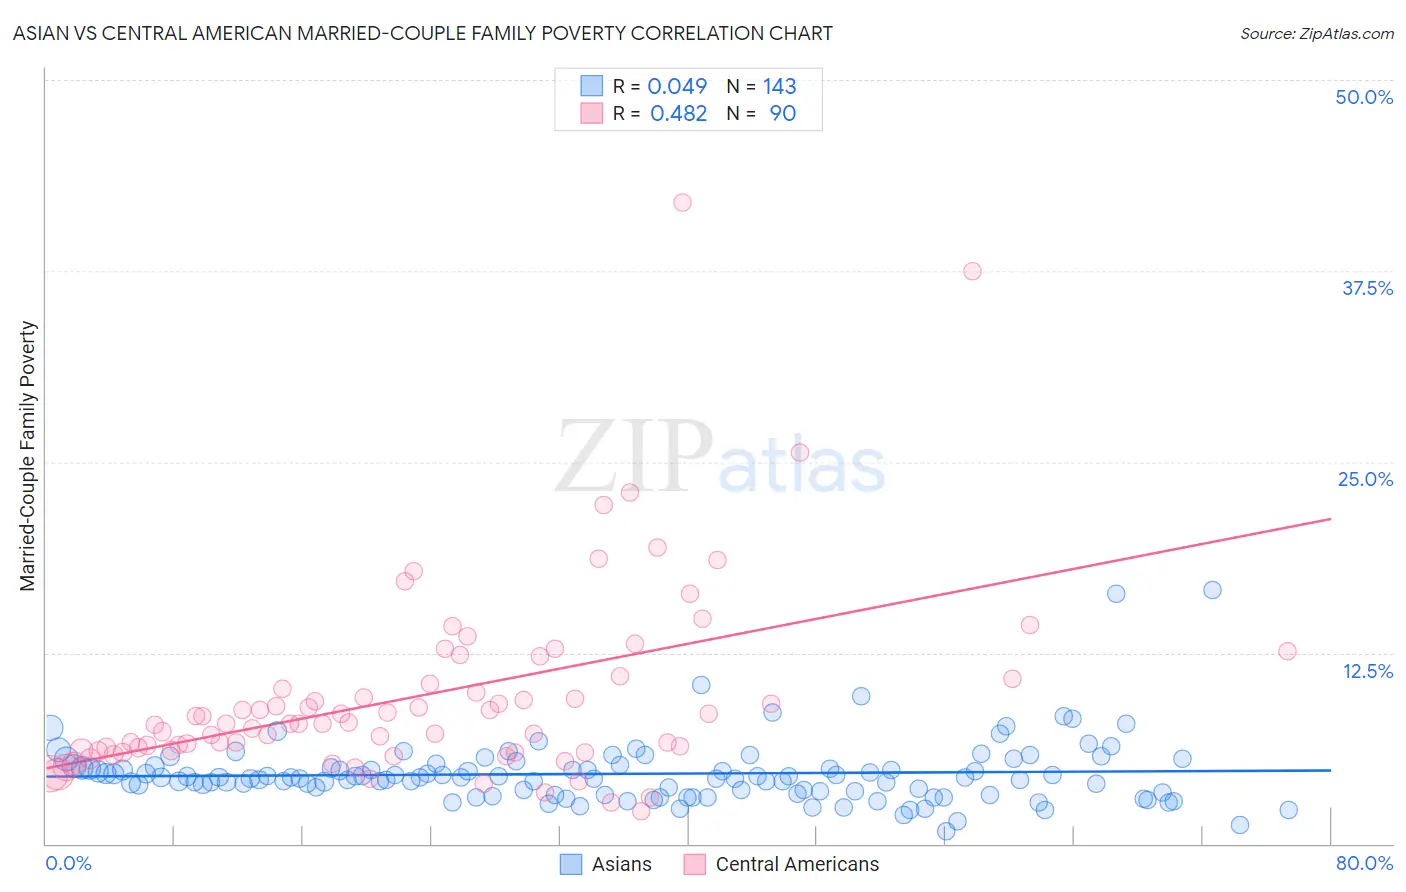
Asian vs Central American Married-Couple Family Poverty Correlation Chart
The statistical analysis conducted on geographies consisting of 539,455,145 people shows no correlation between the proportion of Asians and poverty level among married-couple families in the United States with a correlation coefficient (R) of 0.049 and weighted average of 4.7%. Similarly, the statistical analysis conducted on geographies consisting of 497,895,847 people shows a moderate positive correlation between the proportion of Central Americans and poverty level among married-couple families in the United States with a correlation coefficient (R) of 0.482 and weighted average of 6.7%, a difference of 44.7%.
Married-Couple Family Poverty Correlation Summary
| Measurement | Asian | Central American |
| Minimum | 0.82% | 2.1% |
| Maximum | 16.6% | 41.9% |
| Range | 15.8% | 39.8% |
| Mean | 4.6% | 9.7% |
| Median | 4.3% | 7.9% |
| Interquartile 25% (IQ1) | 3.3% | 6.1% |
| Interquartile 75% (IQ3) | 5.1% | 10.8% |
| Interquartile Range (IQR) | 1.7% | 4.7% |
| Standard Deviation (Sample) | 2.1% | 6.5% |
| Standard Deviation (Population) | 2.1% | 6.4% |
Similar Demographics by Married-Couple Family Poverty
Demographics Similar to Asians by Married-Couple Family Poverty
In terms of married-couple family poverty, the demographic groups most similar to Asians are Immigrants from Romania (4.7%, a difference of 0.29%), Yugoslavian (4.6%, a difference of 0.40%), Immigrants from Western Europe (4.6%, a difference of 0.42%), Immigrants from Europe (4.6%, a difference of 0.53%), and Immigrants from Moldova (4.7%, a difference of 0.63%).
| Demographics | Rating | Rank | Married-Couple Family Poverty |
| Portuguese | 98.3 /100 | #95 | Exceptional 4.6% |
| Immigrants | Poland | 98.3 /100 | #96 | Exceptional 4.6% |
| Immigrants | Belgium | 98.2 /100 | #97 | Exceptional 4.6% |
| Native Hawaiians | 98.0 /100 | #98 | Exceptional 4.6% |
| Immigrants | Europe | 97.9 /100 | #99 | Exceptional 4.6% |
| Immigrants | Western Europe | 97.9 /100 | #100 | Exceptional 4.6% |
| Yugoslavians | 97.8 /100 | #101 | Exceptional 4.6% |
| Asians | 97.6 /100 | #102 | Exceptional 4.7% |
| Immigrants | Romania | 97.3 /100 | #103 | Exceptional 4.7% |
| Immigrants | Moldova | 97.1 /100 | #104 | Exceptional 4.7% |
| Aleuts | 97.0 /100 | #105 | Exceptional 4.7% |
| Immigrants | France | 96.9 /100 | #106 | Exceptional 4.7% |
| Immigrants | Germany | 96.8 /100 | #107 | Exceptional 4.7% |
| Laotians | 96.6 /100 | #108 | Exceptional 4.7% |
| Immigrants | Hong Kong | 96.4 /100 | #109 | Exceptional 4.7% |
Demographics Similar to Central Americans by Married-Couple Family Poverty
In terms of married-couple family poverty, the demographic groups most similar to Central Americans are Immigrants from Ecuador (6.7%, a difference of 0.14%), Immigrants from El Salvador (6.8%, a difference of 0.42%), Immigrants from Belize (6.7%, a difference of 0.60%), Nicaraguan (6.7%, a difference of 0.75%), and Cuban (6.8%, a difference of 0.86%).
| Demographics | Rating | Rank | Married-Couple Family Poverty |
| Bahamians | 0.0 /100 | #294 | Tragic 6.6% |
| Immigrants | Uzbekistan | 0.0 /100 | #295 | Tragic 6.6% |
| U.S. Virgin Islanders | 0.0 /100 | #296 | Tragic 6.6% |
| Kiowa | 0.0 /100 | #297 | Tragic 6.6% |
| Immigrants | Guyana | 0.0 /100 | #298 | Tragic 6.7% |
| Nicaraguans | 0.0 /100 | #299 | Tragic 6.7% |
| Immigrants | Belize | 0.0 /100 | #300 | Tragic 6.7% |
| Central Americans | 0.0 /100 | #301 | Tragic 6.7% |
| Immigrants | Ecuador | 0.0 /100 | #302 | Tragic 6.7% |
| Immigrants | El Salvador | 0.0 /100 | #303 | Tragic 6.8% |
| Cubans | 0.0 /100 | #304 | Tragic 6.8% |
| Haitians | 0.0 /100 | #305 | Tragic 6.8% |
| Immigrants | Haiti | 0.0 /100 | #306 | Tragic 7.0% |
| Guatemalans | 0.0 /100 | #307 | Tragic 7.0% |
| Spanish American Indians | 0.0 /100 | #308 | Tragic 7.1% |