Argentinean vs Immigrants from Israel Married-Couple Family Poverty
COMPARE
Argentinean
Immigrants from Israel
Married-Couple Family Poverty
Married-Couple Family Poverty Comparison
Argentineans
Immigrants from Israel
5.1%
MARRIED-COUPLE FAMILY POVERTY
70.7/ 100
METRIC RATING
157th/ 347
METRIC RANK
5.4%
MARRIED-COUPLE FAMILY POVERTY
27.8/ 100
METRIC RATING
194th/ 347
METRIC RANK
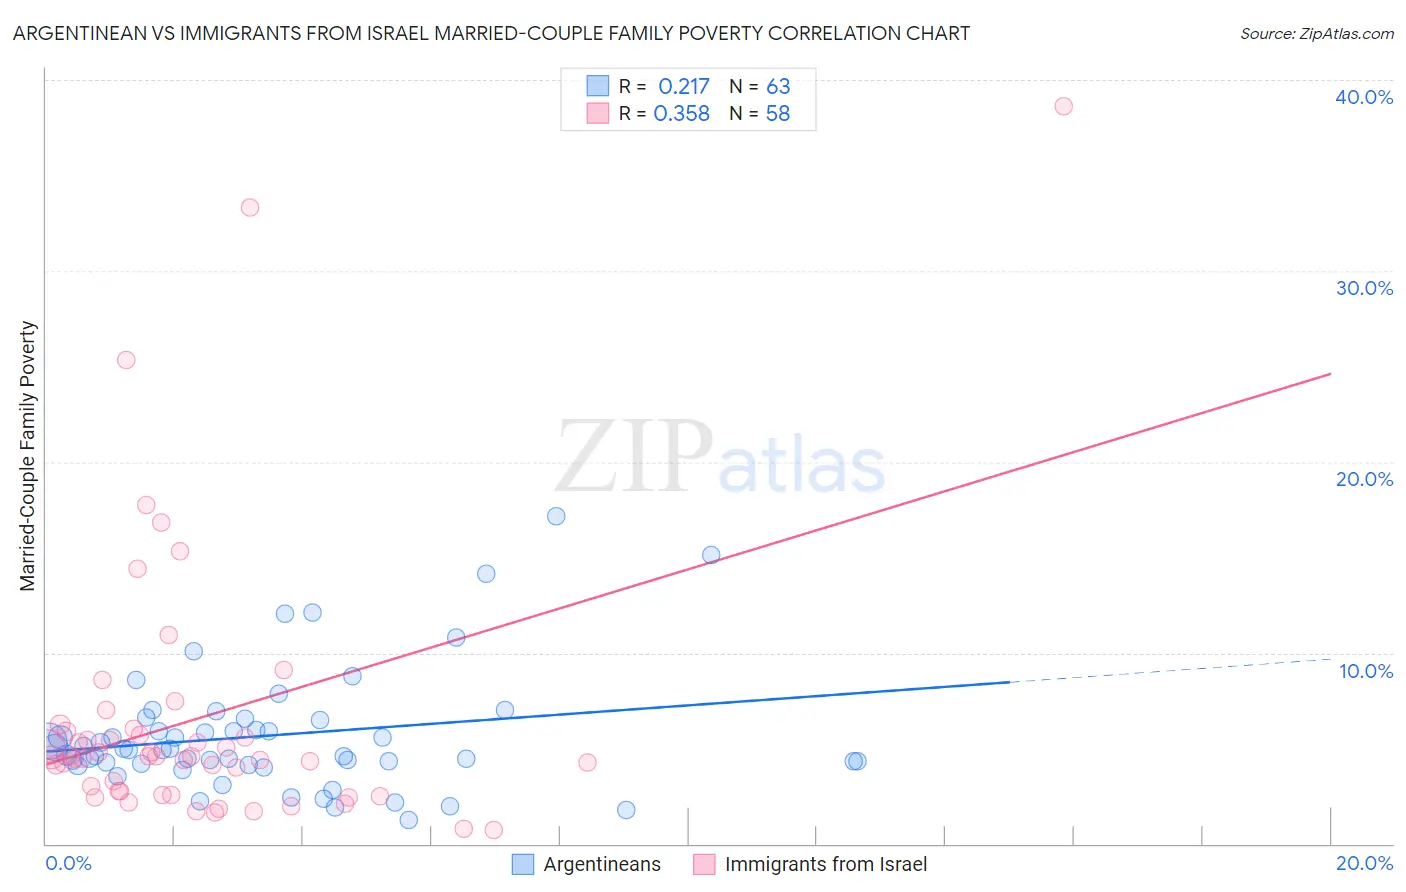
Argentinean vs Immigrants from Israel Married-Couple Family Poverty Correlation Chart
The statistical analysis conducted on geographies consisting of 295,403,165 people shows a weak positive correlation between the proportion of Argentineans and poverty level among married-couple families in the United States with a correlation coefficient (R) of 0.217 and weighted average of 5.1%. Similarly, the statistical analysis conducted on geographies consisting of 209,060,562 people shows a mild positive correlation between the proportion of Immigrants from Israel and poverty level among married-couple families in the United States with a correlation coefficient (R) of 0.358 and weighted average of 5.4%, a difference of 5.5%.
Married-Couple Family Poverty Correlation Summary
| Measurement | Argentinean | Immigrants from Israel |
| Minimum | 1.2% | 0.74% |
| Maximum | 17.1% | 38.6% |
| Range | 15.9% | 37.9% |
| Mean | 5.7% | 6.5% |
| Median | 4.9% | 4.5% |
| Interquartile 25% (IQ1) | 4.2% | 2.7% |
| Interquartile 75% (IQ3) | 6.5% | 5.9% |
| Interquartile Range (IQR) | 2.3% | 3.2% |
| Standard Deviation (Sample) | 3.2% | 7.2% |
| Standard Deviation (Population) | 3.1% | 7.1% |
Similar Demographics by Married-Couple Family Poverty
Demographics Similar to Argentineans by Married-Couple Family Poverty
In terms of married-couple family poverty, the demographic groups most similar to Argentineans are Immigrants from South Eastern Asia (5.1%, a difference of 0.050%), Immigrants from Saudi Arabia (5.1%, a difference of 0.050%), Sri Lankan (5.1%, a difference of 0.22%), Immigrants from Ethiopia (5.1%, a difference of 0.26%), and Pennsylvania German (5.1%, a difference of 0.30%).
| Demographics | Rating | Rank | Married-Couple Family Poverty |
| Brazilians | 78.3 /100 | #150 | Good 5.0% |
| Immigrants | Cameroon | 77.3 /100 | #151 | Good 5.0% |
| Albanians | 77.2 /100 | #152 | Good 5.0% |
| Immigrants | Kuwait | 76.3 /100 | #153 | Good 5.0% |
| Delaware | 73.7 /100 | #154 | Good 5.1% |
| Immigrants | Ethiopia | 72.4 /100 | #155 | Good 5.1% |
| Sri Lankans | 72.2 /100 | #156 | Good 5.1% |
| Argentineans | 70.7 /100 | #157 | Good 5.1% |
| Immigrants | South Eastern Asia | 70.4 /100 | #158 | Good 5.1% |
| Immigrants | Saudi Arabia | 70.3 /100 | #159 | Good 5.1% |
| Pennsylvania Germans | 68.5 /100 | #160 | Good 5.1% |
| Ethiopians | 68.1 /100 | #161 | Good 5.1% |
| Immigrants | Jordan | 66.5 /100 | #162 | Good 5.1% |
| Sierra Leoneans | 64.1 /100 | #163 | Good 5.1% |
| Hawaiians | 62.3 /100 | #164 | Good 5.1% |
Demographics Similar to Immigrants from Israel by Married-Couple Family Poverty
In terms of married-couple family poverty, the demographic groups most similar to Immigrants from Israel are Immigrants from the Azores (5.4%, a difference of 0.040%), Spaniard (5.4%, a difference of 0.060%), Malaysian (5.4%, a difference of 0.22%), Liberian (5.4%, a difference of 0.22%), and Immigrants from Belarus (5.4%, a difference of 0.24%).
| Demographics | Rating | Rank | Married-Couple Family Poverty |
| Immigrants | Albania | 33.8 /100 | #187 | Fair 5.3% |
| Israelis | 33.1 /100 | #188 | Fair 5.3% |
| South American Indians | 32.5 /100 | #189 | Fair 5.3% |
| Ugandans | 31.6 /100 | #190 | Fair 5.3% |
| Immigrants | Cabo Verde | 30.9 /100 | #191 | Fair 5.3% |
| Cape Verdeans | 30.7 /100 | #192 | Fair 5.3% |
| Malaysians | 29.5 /100 | #193 | Fair 5.4% |
| Immigrants | Israel | 27.8 /100 | #194 | Fair 5.4% |
| Immigrants | Azores | 27.5 /100 | #195 | Fair 5.4% |
| Spaniards | 27.4 /100 | #196 | Fair 5.4% |
| Liberians | 26.3 /100 | #197 | Fair 5.4% |
| Immigrants | Belarus | 26.2 /100 | #198 | Fair 5.4% |
| Uruguayans | 25.0 /100 | #199 | Fair 5.4% |
| Immigrants | Morocco | 24.3 /100 | #200 | Fair 5.4% |
| Lebanese | 24.1 /100 | #201 | Fair 5.4% |