Argentinean vs Dutch Single Father Households
COMPARE
Argentinean
Dutch
Single Father Households
Single Father Households Comparison
Argentineans
Dutch
2.1%
SINGLE FATHER HOUSEHOLDS
98.9/ 100
METRIC RATING
102nd/ 347
METRIC RANK
2.4%
SINGLE FATHER HOUSEHOLDS
14.3/ 100
METRIC RATING
217th/ 347
METRIC RANK
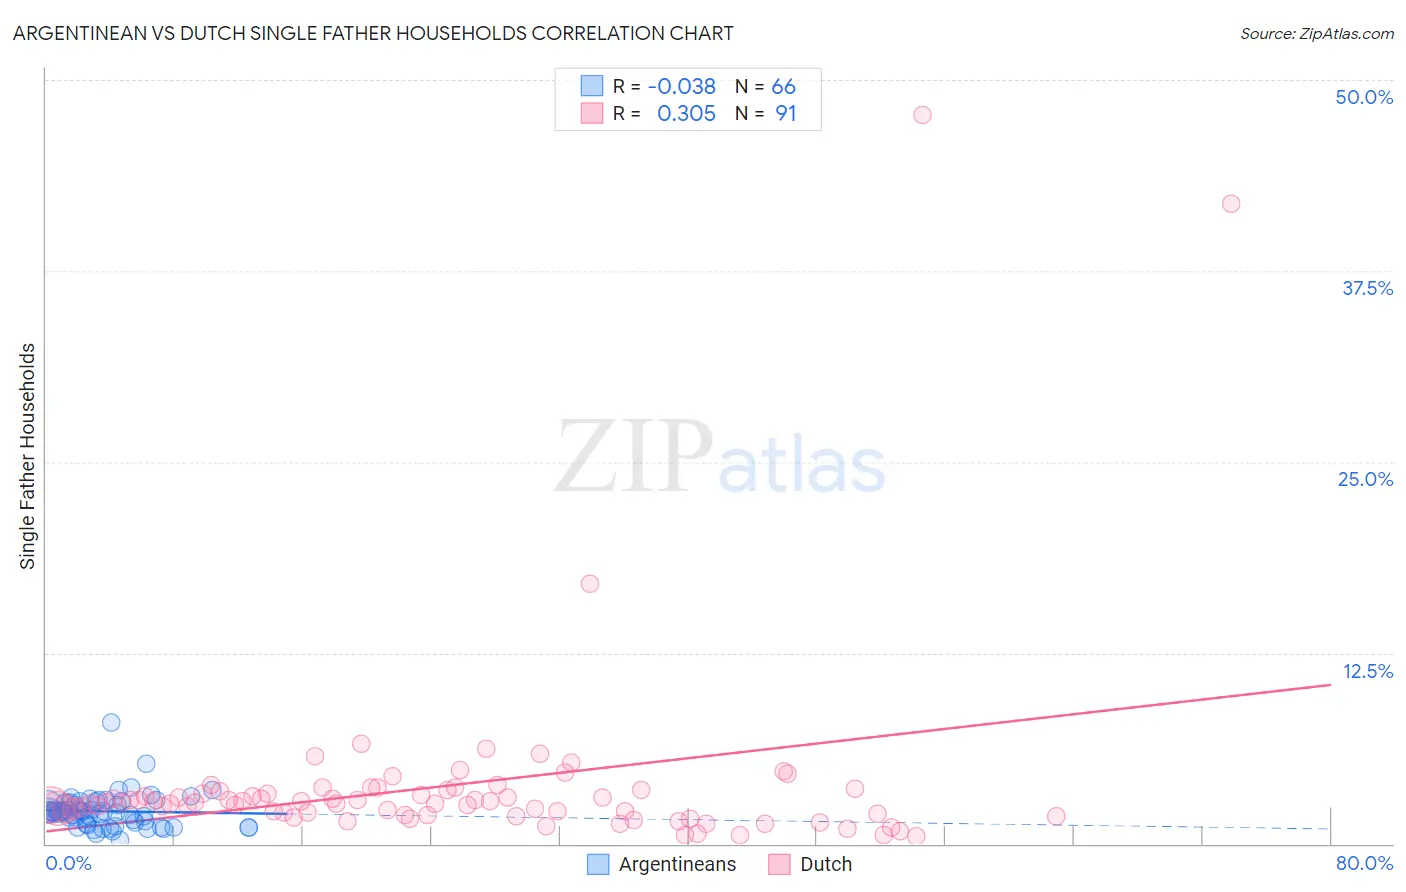
Argentinean vs Dutch Single Father Households Correlation Chart
The statistical analysis conducted on geographies consisting of 295,652,417 people shows no correlation between the proportion of Argentineans and percentage of single father households in the United States with a correlation coefficient (R) of -0.038 and weighted average of 2.1%. Similarly, the statistical analysis conducted on geographies consisting of 541,429,246 people shows a mild positive correlation between the proportion of Dutch and percentage of single father households in the United States with a correlation coefficient (R) of 0.305 and weighted average of 2.4%, a difference of 12.6%.
Single Father Households Correlation Summary
| Measurement | Argentinean | Dutch |
| Minimum | 0.26% | 0.50% |
| Maximum | 7.9% | 47.7% |
| Range | 7.6% | 47.2% |
| Mean | 2.1% | 3.8% |
| Median | 2.1% | 2.7% |
| Interquartile 25% (IQ1) | 1.4% | 1.9% |
| Interquartile 75% (IQ3) | 2.7% | 3.4% |
| Interquartile Range (IQR) | 1.3% | 1.5% |
| Standard Deviation (Sample) | 1.1% | 6.5% |
| Standard Deviation (Population) | 1.1% | 6.5% |
Similar Demographics by Single Father Households
Demographics Similar to Argentineans by Single Father Households
In terms of single father households, the demographic groups most similar to Argentineans are Lebanese (2.1%, a difference of 0.020%), Immigrants from Western Europe (2.1%, a difference of 0.030%), Alsatian (2.1%, a difference of 0.040%), Immigrants from Northern Africa (2.1%, a difference of 0.18%), and South African (2.1%, a difference of 0.33%).
| Demographics | Rating | Rank | Single Father Households |
| Bermudans | 99.2 /100 | #95 | Exceptional 2.1% |
| Arabs | 99.2 /100 | #96 | Exceptional 2.1% |
| Immigrants | Moldova | 99.1 /100 | #97 | Exceptional 2.1% |
| Guyanese | 99.1 /100 | #98 | Exceptional 2.1% |
| South Africans | 99.1 /100 | #99 | Exceptional 2.1% |
| Immigrants | Northern Africa | 99.0 /100 | #100 | Exceptional 2.1% |
| Immigrants | Western Europe | 98.9 /100 | #101 | Exceptional 2.1% |
| Argentineans | 98.9 /100 | #102 | Exceptional 2.1% |
| Lebanese | 98.9 /100 | #103 | Exceptional 2.1% |
| Alsatians | 98.9 /100 | #104 | Exceptional 2.1% |
| Palestinians | 98.6 /100 | #105 | Exceptional 2.2% |
| Immigrants | Southern Europe | 98.6 /100 | #106 | Exceptional 2.2% |
| Slovenes | 98.5 /100 | #107 | Exceptional 2.2% |
| Immigrants | Netherlands | 98.5 /100 | #108 | Exceptional 2.2% |
| Barbadians | 98.4 /100 | #109 | Exceptional 2.2% |
Demographics Similar to Dutch by Single Father Households
In terms of single father households, the demographic groups most similar to Dutch are Immigrants from Ecuador (2.4%, a difference of 0.090%), Immigrants from Ethiopia (2.4%, a difference of 0.13%), Sudanese (2.4%, a difference of 0.20%), Ghanaian (2.4%, a difference of 0.21%), and Immigrants from South Eastern Asia (2.4%, a difference of 0.22%).
| Demographics | Rating | Rank | Single Father Households |
| Immigrants | Costa Rica | 19.2 /100 | #210 | Poor 2.4% |
| Immigrants | Nigeria | 18.7 /100 | #211 | Poor 2.4% |
| Finns | 18.3 /100 | #212 | Poor 2.4% |
| Norwegians | 17.1 /100 | #213 | Poor 2.4% |
| Ethiopians | 16.6 /100 | #214 | Poor 2.4% |
| Immigrants | South Eastern Asia | 15.9 /100 | #215 | Poor 2.4% |
| Immigrants | Ecuador | 14.9 /100 | #216 | Poor 2.4% |
| Dutch | 14.3 /100 | #217 | Poor 2.4% |
| Immigrants | Ethiopia | 13.4 /100 | #218 | Poor 2.4% |
| Sudanese | 13.0 /100 | #219 | Poor 2.4% |
| Ghanaians | 12.9 /100 | #220 | Poor 2.4% |
| Immigrants | Burma/Myanmar | 12.1 /100 | #221 | Poor 2.4% |
| Immigrants | Eastern Africa | 11.9 /100 | #222 | Poor 2.4% |
| Immigrants | Uruguay | 11.0 /100 | #223 | Poor 2.4% |
| Immigrants | Bahamas | 10.6 /100 | #224 | Poor 2.4% |