Alaskan Athabascan vs Korean Married-Couple Family Poverty
COMPARE
Alaskan Athabascan
Korean
Married-Couple Family Poverty
Married-Couple Family Poverty Comparison
Alaskan Athabascans
Koreans
6.1%
MARRIED-COUPLE FAMILY POVERTY
0.4/ 100
METRIC RATING
259th/ 347
METRIC RANK
4.6%
MARRIED-COUPLE FAMILY POVERTY
98.3/ 100
METRIC RATING
93rd/ 347
METRIC RANK
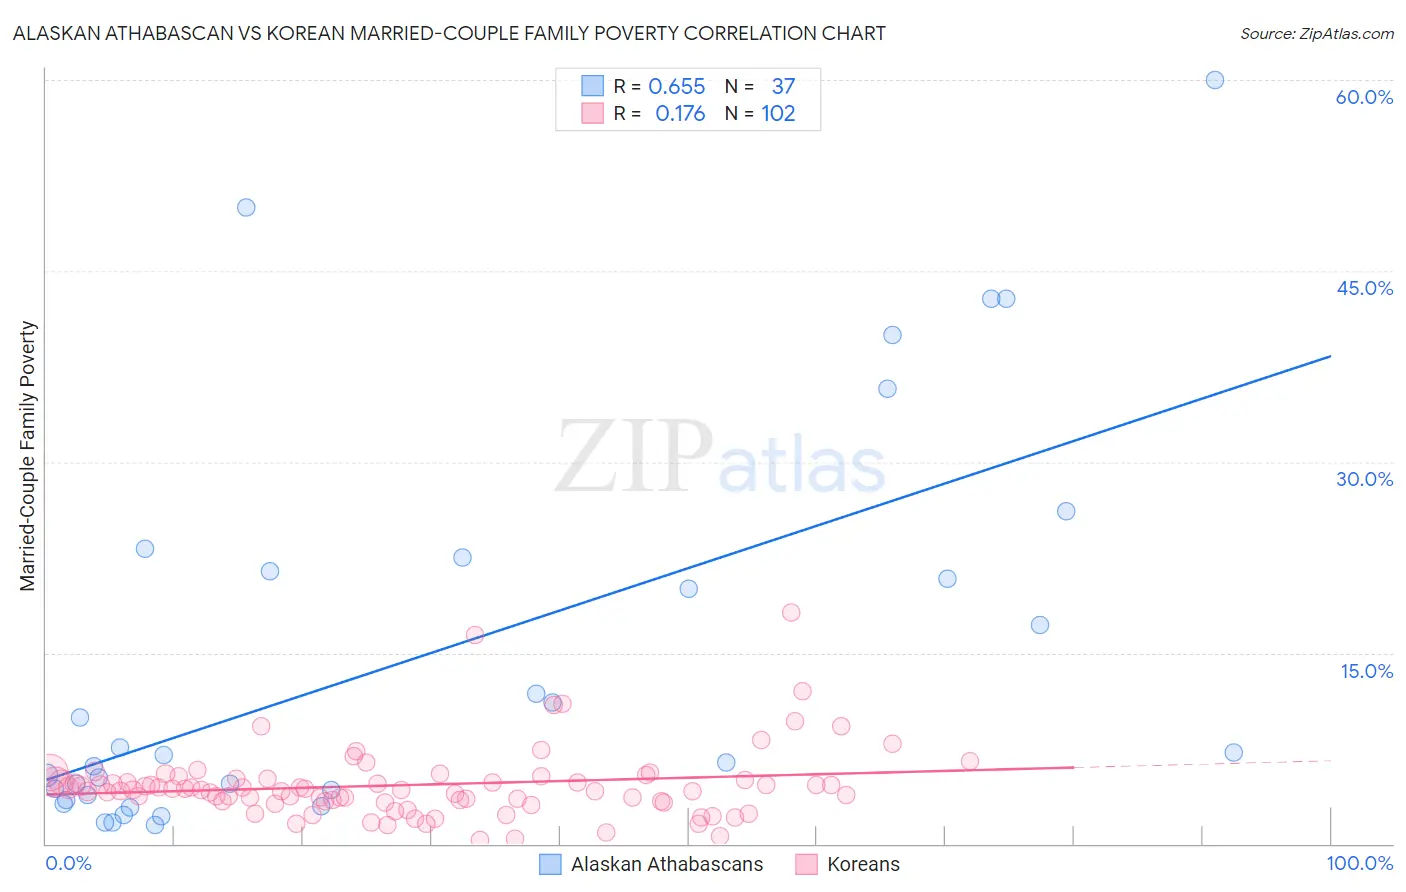
Alaskan Athabascan vs Korean Married-Couple Family Poverty Correlation Chart
The statistical analysis conducted on geographies consisting of 45,695,743 people shows a significant positive correlation between the proportion of Alaskan Athabascans and poverty level among married-couple families in the United States with a correlation coefficient (R) of 0.655 and weighted average of 6.1%. Similarly, the statistical analysis conducted on geographies consisting of 503,402,719 people shows a poor positive correlation between the proportion of Koreans and poverty level among married-couple families in the United States with a correlation coefficient (R) of 0.176 and weighted average of 4.6%, a difference of 31.9%.
Married-Couple Family Poverty Correlation Summary
| Measurement | Alaskan Athabascan | Korean |
| Minimum | 1.5% | 0.27% |
| Maximum | 60.0% | 18.2% |
| Range | 58.5% | 17.9% |
| Mean | 14.7% | 4.6% |
| Median | 7.0% | 4.3% |
| Interquartile 25% (IQ1) | 3.6% | 3.3% |
| Interquartile 75% (IQ3) | 21.9% | 5.1% |
| Interquartile Range (IQR) | 18.3% | 1.8% |
| Standard Deviation (Sample) | 15.6% | 2.8% |
| Standard Deviation (Population) | 15.4% | 2.8% |
Similar Demographics by Married-Couple Family Poverty
Demographics Similar to Alaskan Athabascans by Married-Couple Family Poverty
In terms of married-couple family poverty, the demographic groups most similar to Alaskan Athabascans are Jamaican (6.1%, a difference of 0.21%), Senegalese (6.1%, a difference of 0.40%), Immigrants (6.0%, a difference of 0.58%), Shoshone (6.1%, a difference of 0.61%), and Immigrants from Burma/Myanmar (6.0%, a difference of 0.71%).
| Demographics | Rating | Rank | Married-Couple Family Poverty |
| Immigrants | Western Asia | 0.7 /100 | #252 | Tragic 6.0% |
| Africans | 0.7 /100 | #253 | Tragic 6.0% |
| Immigrants | Somalia | 0.7 /100 | #254 | Tragic 6.0% |
| Comanche | 0.7 /100 | #255 | Tragic 6.0% |
| Bangladeshis | 0.5 /100 | #256 | Tragic 6.0% |
| Immigrants | Burma/Myanmar | 0.5 /100 | #257 | Tragic 6.0% |
| Immigrants | Immigrants | 0.5 /100 | #258 | Tragic 6.0% |
| Alaskan Athabascans | 0.4 /100 | #259 | Tragic 6.1% |
| Jamaicans | 0.3 /100 | #260 | Tragic 6.1% |
| Senegalese | 0.3 /100 | #261 | Tragic 6.1% |
| Shoshone | 0.3 /100 | #262 | Tragic 6.1% |
| Immigrants | Senegal | 0.3 /100 | #263 | Tragic 6.1% |
| Immigrants | Congo | 0.2 /100 | #264 | Tragic 6.1% |
| Blackfeet | 0.2 /100 | #265 | Tragic 6.2% |
| Creek | 0.2 /100 | #266 | Tragic 6.2% |
Demographics Similar to Koreans by Married-Couple Family Poverty
In terms of married-couple family poverty, the demographic groups most similar to Koreans are Immigrants from Italy (4.6%, a difference of 0.050%), Portuguese (4.6%, a difference of 0.090%), Immigrants from Poland (4.6%, a difference of 0.17%), Immigrants from Norway (4.6%, a difference of 0.18%), and Immigrants from Belgium (4.6%, a difference of 0.22%).
| Demographics | Rating | Rank | Married-Couple Family Poverty |
| Immigrants | Turkey | 98.6 /100 | #86 | Exceptional 4.6% |
| Immigrants | North Macedonia | 98.6 /100 | #87 | Exceptional 4.6% |
| Bolivians | 98.6 /100 | #88 | Exceptional 4.6% |
| Immigrants | Czechoslovakia | 98.5 /100 | #89 | Exceptional 4.6% |
| Immigrants | Switzerland | 98.5 /100 | #90 | Exceptional 4.6% |
| Basques | 98.5 /100 | #91 | Exceptional 4.6% |
| Immigrants | Norway | 98.4 /100 | #92 | Exceptional 4.6% |
| Koreans | 98.3 /100 | #93 | Exceptional 4.6% |
| Immigrants | Italy | 98.3 /100 | #94 | Exceptional 4.6% |
| Portuguese | 98.3 /100 | #95 | Exceptional 4.6% |
| Immigrants | Poland | 98.3 /100 | #96 | Exceptional 4.6% |
| Immigrants | Belgium | 98.2 /100 | #97 | Exceptional 4.6% |
| Native Hawaiians | 98.0 /100 | #98 | Exceptional 4.6% |
| Immigrants | Europe | 97.9 /100 | #99 | Exceptional 4.6% |
| Immigrants | Western Europe | 97.9 /100 | #100 | Exceptional 4.6% |