Alaskan Athabascan vs Immigrants from Ireland Married-Couple Family Poverty
COMPARE
Alaskan Athabascan
Immigrants from Ireland
Married-Couple Family Poverty
Married-Couple Family Poverty Comparison
Alaskan Athabascans
Immigrants from Ireland
6.1%
MARRIED-COUPLE FAMILY POVERTY
0.4/ 100
METRIC RATING
259th/ 347
METRIC RANK
4.1%
MARRIED-COUPLE FAMILY POVERTY
99.9/ 100
METRIC RATING
19th/ 347
METRIC RANK
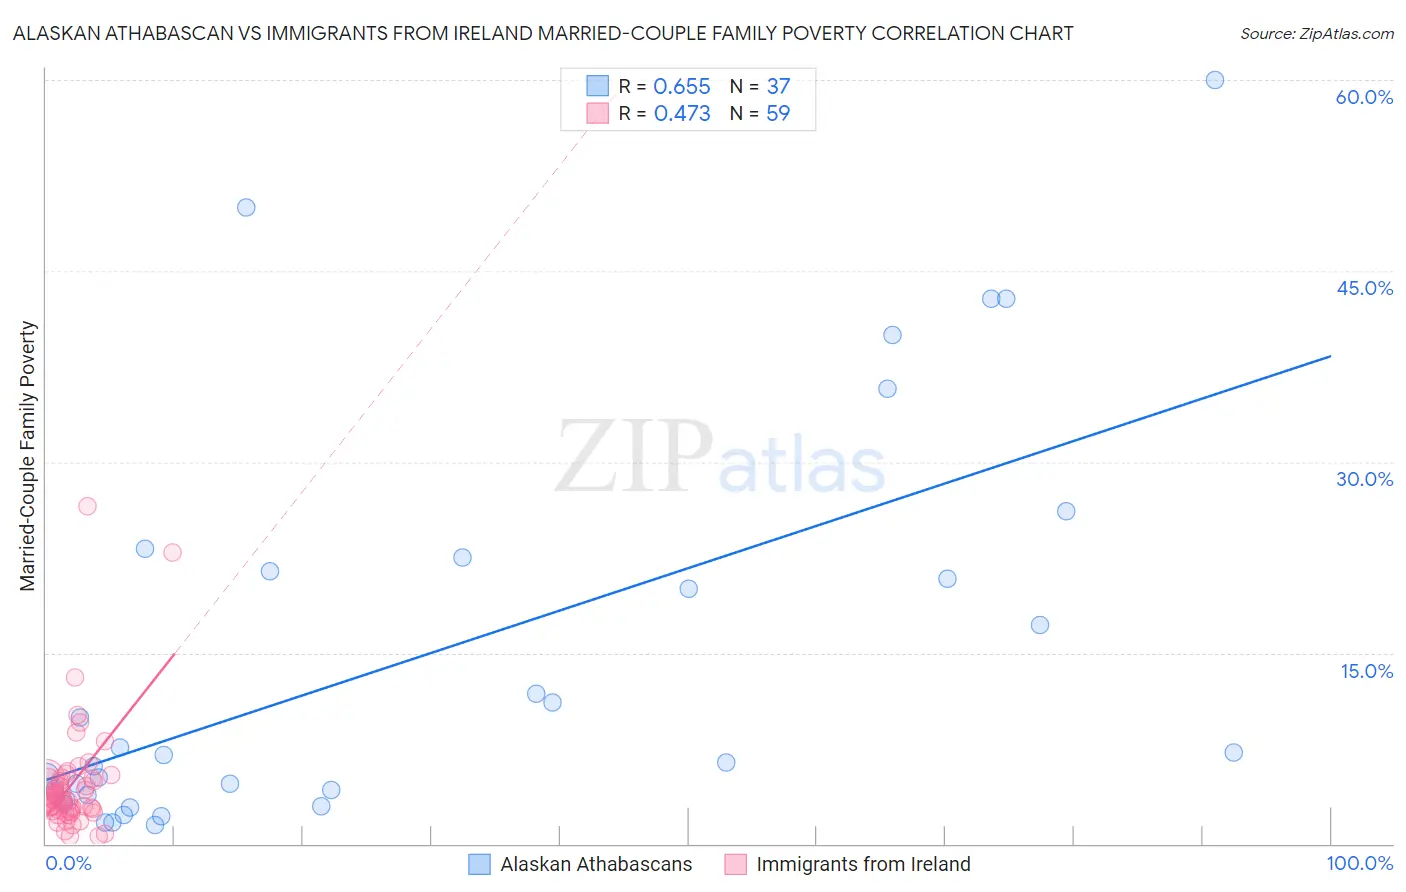
Alaskan Athabascan vs Immigrants from Ireland Married-Couple Family Poverty Correlation Chart
The statistical analysis conducted on geographies consisting of 45,695,743 people shows a significant positive correlation between the proportion of Alaskan Athabascans and poverty level among married-couple families in the United States with a correlation coefficient (R) of 0.655 and weighted average of 6.1%. Similarly, the statistical analysis conducted on geographies consisting of 239,104,626 people shows a moderate positive correlation between the proportion of Immigrants from Ireland and poverty level among married-couple families in the United States with a correlation coefficient (R) of 0.473 and weighted average of 4.1%, a difference of 49.1%.
Married-Couple Family Poverty Correlation Summary
| Measurement | Alaskan Athabascan | Immigrants from Ireland |
| Minimum | 1.5% | 0.56% |
| Maximum | 60.0% | 26.5% |
| Range | 58.5% | 25.9% |
| Mean | 14.7% | 4.7% |
| Median | 7.0% | 3.5% |
| Interquartile 25% (IQ1) | 3.6% | 2.6% |
| Interquartile 75% (IQ3) | 21.9% | 5.1% |
| Interquartile Range (IQR) | 18.3% | 2.5% |
| Standard Deviation (Sample) | 15.6% | 4.4% |
| Standard Deviation (Population) | 15.4% | 4.4% |
Similar Demographics by Married-Couple Family Poverty
Demographics Similar to Alaskan Athabascans by Married-Couple Family Poverty
In terms of married-couple family poverty, the demographic groups most similar to Alaskan Athabascans are Jamaican (6.1%, a difference of 0.21%), Senegalese (6.1%, a difference of 0.40%), Immigrants (6.0%, a difference of 0.58%), Shoshone (6.1%, a difference of 0.61%), and Immigrants from Burma/Myanmar (6.0%, a difference of 0.71%).
| Demographics | Rating | Rank | Married-Couple Family Poverty |
| Immigrants | Western Asia | 0.7 /100 | #252 | Tragic 6.0% |
| Africans | 0.7 /100 | #253 | Tragic 6.0% |
| Immigrants | Somalia | 0.7 /100 | #254 | Tragic 6.0% |
| Comanche | 0.7 /100 | #255 | Tragic 6.0% |
| Bangladeshis | 0.5 /100 | #256 | Tragic 6.0% |
| Immigrants | Burma/Myanmar | 0.5 /100 | #257 | Tragic 6.0% |
| Immigrants | Immigrants | 0.5 /100 | #258 | Tragic 6.0% |
| Alaskan Athabascans | 0.4 /100 | #259 | Tragic 6.1% |
| Jamaicans | 0.3 /100 | #260 | Tragic 6.1% |
| Senegalese | 0.3 /100 | #261 | Tragic 6.1% |
| Shoshone | 0.3 /100 | #262 | Tragic 6.1% |
| Immigrants | Senegal | 0.3 /100 | #263 | Tragic 6.1% |
| Immigrants | Congo | 0.2 /100 | #264 | Tragic 6.1% |
| Blackfeet | 0.2 /100 | #265 | Tragic 6.2% |
| Creek | 0.2 /100 | #266 | Tragic 6.2% |
Demographics Similar to Immigrants from Ireland by Married-Couple Family Poverty
In terms of married-couple family poverty, the demographic groups most similar to Immigrants from Ireland are Maltese (4.1%, a difference of 0.25%), Zimbabwean (4.1%, a difference of 0.27%), Immigrants from Singapore (4.1%, a difference of 0.64%), Bhutanese (4.1%, a difference of 0.66%), and Italian (4.0%, a difference of 0.78%).
| Demographics | Rating | Rank | Married-Couple Family Poverty |
| Bulgarians | 100.0 /100 | #12 | Exceptional 4.0% |
| Czechs | 100.0 /100 | #13 | Exceptional 4.0% |
| Slovaks | 100.0 /100 | #14 | Exceptional 4.0% |
| Poles | 100.0 /100 | #15 | Exceptional 4.0% |
| Germans | 100.0 /100 | #16 | Exceptional 4.0% |
| Filipinos | 100.0 /100 | #17 | Exceptional 4.0% |
| Italians | 100.0 /100 | #18 | Exceptional 4.0% |
| Immigrants | Ireland | 99.9 /100 | #19 | Exceptional 4.1% |
| Maltese | 99.9 /100 | #20 | Exceptional 4.1% |
| Zimbabweans | 99.9 /100 | #21 | Exceptional 4.1% |
| Immigrants | Singapore | 99.9 /100 | #22 | Exceptional 4.1% |
| Bhutanese | 99.9 /100 | #23 | Exceptional 4.1% |
| Eastern Europeans | 99.9 /100 | #24 | Exceptional 4.1% |
| Immigrants | Taiwan | 99.9 /100 | #25 | Exceptional 4.1% |
| Cypriots | 99.9 /100 | #26 | Exceptional 4.1% |