Hispanic or Latino vs Korean Married-Couple Family Poverty
COMPARE
Hispanic or Latino
Korean
Married-Couple Family Poverty
Married-Couple Family Poverty Comparison
Hispanics or Latinos
Koreans
7.5%
MARRIED-COUPLE FAMILY POVERTY
0.0/ 100
METRIC RATING
327th/ 347
METRIC RANK
4.6%
MARRIED-COUPLE FAMILY POVERTY
98.3/ 100
METRIC RATING
93rd/ 347
METRIC RANK
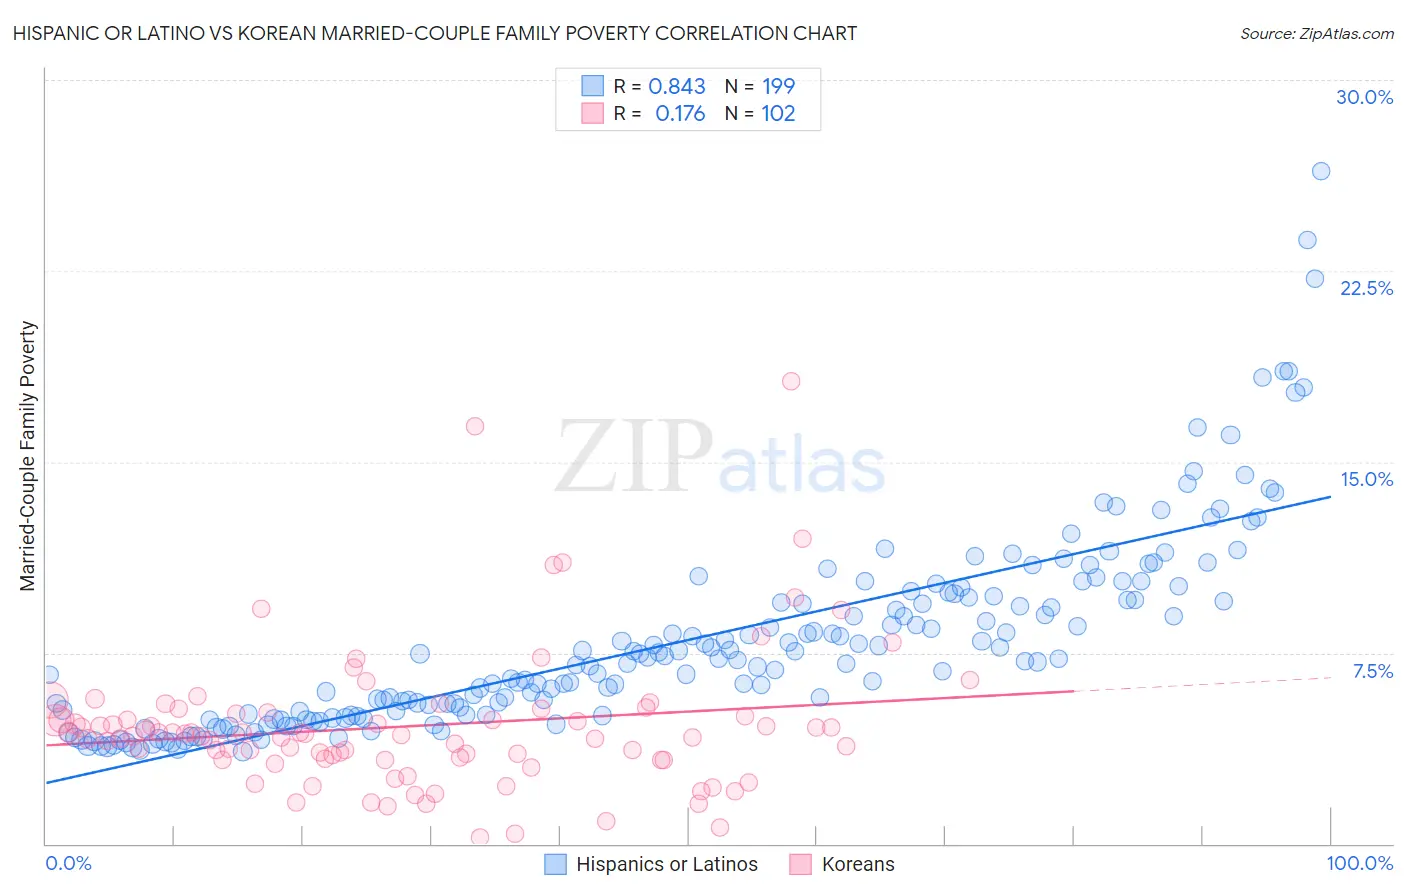
Hispanic or Latino vs Korean Married-Couple Family Poverty Correlation Chart
The statistical analysis conducted on geographies consisting of 561,961,061 people shows a very strong positive correlation between the proportion of Hispanics or Latinos and poverty level among married-couple families in the United States with a correlation coefficient (R) of 0.843 and weighted average of 7.5%. Similarly, the statistical analysis conducted on geographies consisting of 503,402,719 people shows a poor positive correlation between the proportion of Koreans and poverty level among married-couple families in the United States with a correlation coefficient (R) of 0.176 and weighted average of 4.6%, a difference of 62.7%.
Married-Couple Family Poverty Correlation Summary
| Measurement | Hispanic or Latino | Korean |
| Minimum | 3.6% | 0.27% |
| Maximum | 26.4% | 18.2% |
| Range | 22.8% | 17.9% |
| Mean | 8.0% | 4.6% |
| Median | 7.2% | 4.3% |
| Interquartile 25% (IQ1) | 5.1% | 3.3% |
| Interquartile 75% (IQ3) | 9.7% | 5.1% |
| Interquartile Range (IQR) | 4.6% | 1.8% |
| Standard Deviation (Sample) | 3.8% | 2.8% |
| Standard Deviation (Population) | 3.8% | 2.8% |
Similar Demographics by Married-Couple Family Poverty
Demographics Similar to Hispanics or Latinos by Married-Couple Family Poverty
In terms of married-couple family poverty, the demographic groups most similar to Hispanics or Latinos are Immigrants from Bangladesh (7.5%, a difference of 0.0%), Immigrants from Cuba (7.5%, a difference of 0.20%), Immigrants from Central America (7.4%, a difference of 0.73%), Vietnamese (7.4%, a difference of 0.82%), and Immigrants from Mexico (7.6%, a difference of 1.2%).
| Demographics | Rating | Rank | Married-Couple Family Poverty |
| Immigrants | Grenada | 0.0 /100 | #320 | Tragic 7.3% |
| Immigrants | Caribbean | 0.0 /100 | #321 | Tragic 7.3% |
| Immigrants | Honduras | 0.0 /100 | #322 | Tragic 7.3% |
| Vietnamese | 0.0 /100 | #323 | Tragic 7.4% |
| Immigrants | Central America | 0.0 /100 | #324 | Tragic 7.4% |
| Immigrants | Cuba | 0.0 /100 | #325 | Tragic 7.5% |
| Immigrants | Bangladesh | 0.0 /100 | #326 | Tragic 7.5% |
| Hispanics or Latinos | 0.0 /100 | #327 | Tragic 7.5% |
| Immigrants | Mexico | 0.0 /100 | #328 | Tragic 7.6% |
| Natives/Alaskans | 0.0 /100 | #329 | Tragic 8.2% |
| Paiute | 0.0 /100 | #330 | Tragic 8.3% |
| Central American Indians | 0.0 /100 | #331 | Tragic 8.3% |
| Dominicans | 0.0 /100 | #332 | Tragic 8.3% |
| Lumbee | 0.0 /100 | #333 | Tragic 8.3% |
| Immigrants | Dominican Republic | 0.0 /100 | #334 | Tragic 8.4% |
Demographics Similar to Koreans by Married-Couple Family Poverty
In terms of married-couple family poverty, the demographic groups most similar to Koreans are Immigrants from Italy (4.6%, a difference of 0.050%), Portuguese (4.6%, a difference of 0.090%), Immigrants from Poland (4.6%, a difference of 0.17%), Immigrants from Norway (4.6%, a difference of 0.18%), and Immigrants from Belgium (4.6%, a difference of 0.22%).
| Demographics | Rating | Rank | Married-Couple Family Poverty |
| Immigrants | Turkey | 98.6 /100 | #86 | Exceptional 4.6% |
| Immigrants | North Macedonia | 98.6 /100 | #87 | Exceptional 4.6% |
| Bolivians | 98.6 /100 | #88 | Exceptional 4.6% |
| Immigrants | Czechoslovakia | 98.5 /100 | #89 | Exceptional 4.6% |
| Immigrants | Switzerland | 98.5 /100 | #90 | Exceptional 4.6% |
| Basques | 98.5 /100 | #91 | Exceptional 4.6% |
| Immigrants | Norway | 98.4 /100 | #92 | Exceptional 4.6% |
| Koreans | 98.3 /100 | #93 | Exceptional 4.6% |
| Immigrants | Italy | 98.3 /100 | #94 | Exceptional 4.6% |
| Portuguese | 98.3 /100 | #95 | Exceptional 4.6% |
| Immigrants | Poland | 98.3 /100 | #96 | Exceptional 4.6% |
| Immigrants | Belgium | 98.2 /100 | #97 | Exceptional 4.6% |
| Native Hawaiians | 98.0 /100 | #98 | Exceptional 4.6% |
| Immigrants | Europe | 97.9 /100 | #99 | Exceptional 4.6% |
| Immigrants | Western Europe | 97.9 /100 | #100 | Exceptional 4.6% |