Zip Codes with the Highest Percentage of Population Employed in Office & Administration in Portland, OR
RELATED REPORTS & OPTIONS
Office & Administration
Portland
Compare Zip Codes
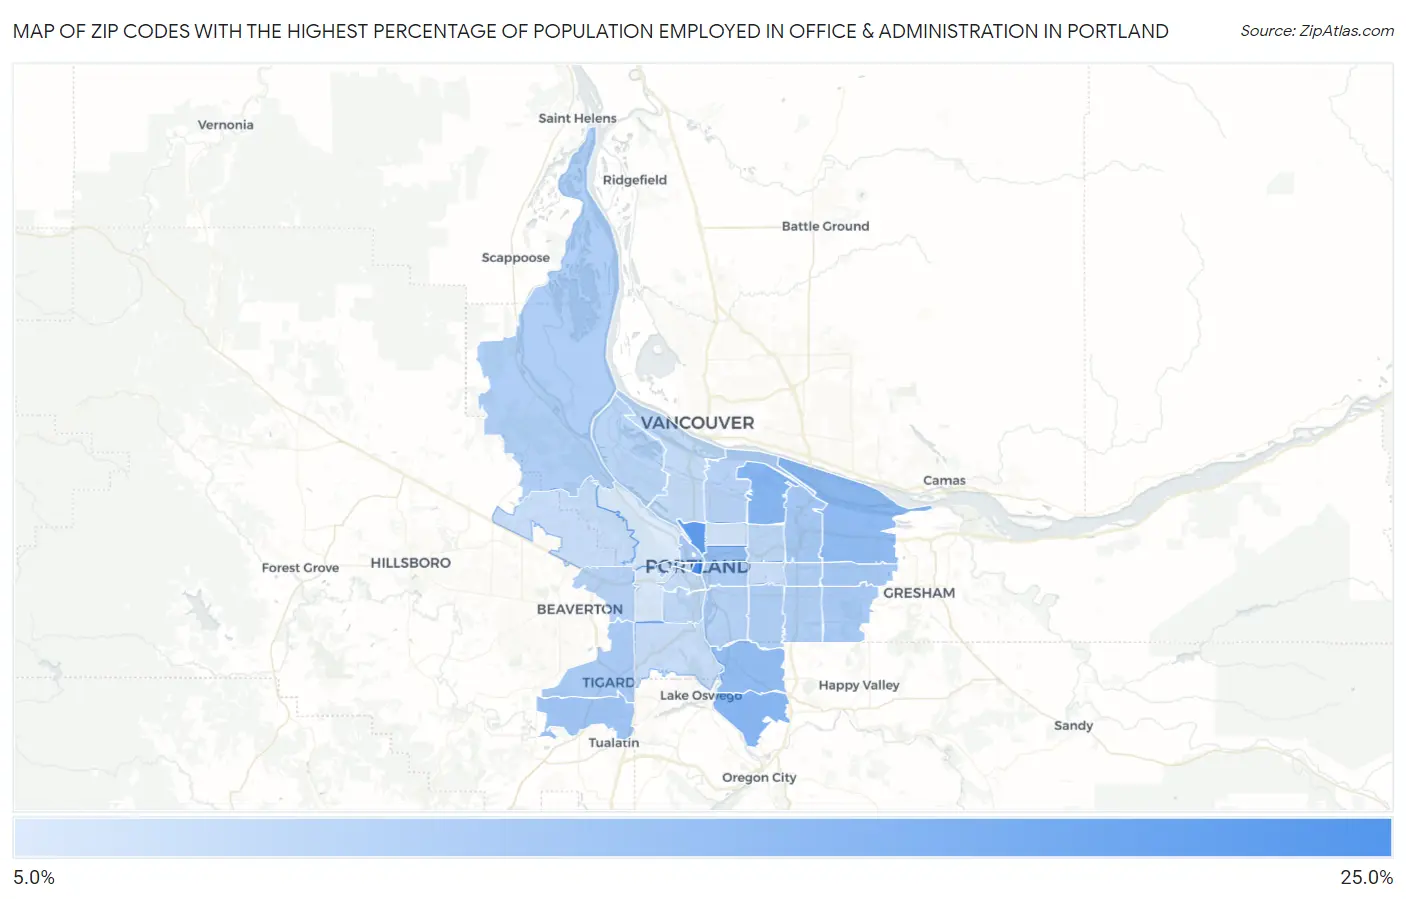
Map of Zip Codes with the Highest Percentage of Population Employed in Office & Administration in Portland
5.3%
20.4%
Zip Codes with the Highest Percentage of Population Employed in Office & Administration in Portland, OR
| Zip Code | % Employed | vs State | vs National | |
| 1. | 97204 | 20.4% | 10.7%(+9.70)#24 | 10.9%(+9.58)#1,593 |
| 2. | 97227 | 18.0% | 10.7%(+7.24)#36 | 10.9%(+7.11)#2,367 |
| 3. | 97218 | 13.8% | 10.7%(+3.06)#85 | 10.9%(+2.94)#6,370 |
| 4. | 97267 | 13.7% | 10.7%(+2.99)#91 | 10.9%(+2.86)#6,503 |
| 5. | 97230 | 12.8% | 10.7%(+2.06)#116 | 10.9%(+1.94)#8,546 |
| 6. | 97232 | 12.5% | 10.7%(+1.78)#118 | 10.9%(+1.66)#9,237 |
| 7. | 97222 | 12.4% | 10.7%(+1.71)#123 | 10.9%(+1.59)#9,445 |
| 8. | 97224 | 11.2% | 10.7%(+0.419)#172 | 10.9%(+0.296)#13,363 |
| 9. | 97233 | 10.6% | 10.7%(-0.092)#187 | 10.9%(-0.215)#14,996 |
| 10. | 97220 | 10.6% | 10.7%(-0.102)#189 | 10.9%(-0.226)#15,033 |
| 11. | 97223 | 10.2% | 10.7%(-0.551)#206 | 10.9%(-0.674)#16,530 |
| 12. | 97236 | 10.1% | 10.7%(-0.600)#207 | 10.9%(-0.724)#16,694 |
| 13. | 97209 | 10.1% | 10.7%(-0.613)#209 | 10.9%(-0.736)#16,727 |
| 14. | 97214 | 9.7% | 10.7%(-1.02)#225 | 10.9%(-1.14)#18,004 |
| 15. | 97216 | 9.5% | 10.7%(-1.22)#233 | 10.9%(-1.34)#18,705 |
| 16. | 97266 | 9.5% | 10.7%(-1.25)#235 | 10.9%(-1.37)#18,807 |
| 17. | 97206 | 9.5% | 10.7%(-1.26)#236 | 10.9%(-1.38)#18,844 |
| 18. | 97231 | 9.5% | 10.7%(-1.27)#237 | 10.9%(-1.40)#18,891 |
| 19. | 97202 | 9.2% | 10.7%(-1.57)#245 | 10.9%(-1.69)#19,771 |
| 20. | 97225 | 8.9% | 10.7%(-1.87)#259 | 10.9%(-1.99)#20,637 |
| 21. | 97211 | 8.8% | 10.7%(-1.93)#262 | 10.9%(-2.06)#20,841 |
| 22. | 97203 | 8.6% | 10.7%(-2.15)#273 | 10.9%(-2.28)#21,480 |
| 23. | 97213 | 8.4% | 10.7%(-2.37)#280 | 10.9%(-2.49)#22,042 |
| 24. | 97205 | 8.3% | 10.7%(-2.46)#282 | 10.9%(-2.59)#22,308 |
| 25. | 97239 | 8.1% | 10.7%(-2.62)#284 | 10.9%(-2.74)#22,747 |
| 26. | 97217 | 7.8% | 10.7%(-2.91)#289 | 10.9%(-3.03)#23,427 |
| 27. | 97201 | 7.8% | 10.7%(-2.98)#290 | 10.9%(-3.10)#23,563 |
| 28. | 97219 | 7.4% | 10.7%(-3.38)#303 | 10.9%(-3.51)#24,508 |
| 29. | 97229 | 7.2% | 10.7%(-3.52)#305 | 10.9%(-3.64)#24,782 |
| 30. | 97215 | 7.2% | 10.7%(-3.55)#306 | 10.9%(-3.67)#24,852 |
| 31. | 97212 | 6.5% | 10.7%(-4.27)#326 | 10.9%(-4.39)#26,156 |
| 32. | 97221 | 5.7% | 10.7%(-5.07)#340 | 10.9%(-5.19)#27,310 |
| 33. | 97210 | 5.3% | 10.7%(-5.40)#347 | 10.9%(-5.52)#27,734 |
1
Common Questions
What are the Top 10 Zip Codes with the Highest Percentage of Population Employed in Office & Administration in Portland, OR?
Top 10 Zip Codes with the Highest Percentage of Population Employed in Office & Administration in Portland, OR are:
What zip code has the Highest Percentage of Population Employed in Office & Administration in Portland, OR?
97204 has the Highest Percentage of Population Employed in Office & Administration in Portland, OR with 20.4%.
What is the Percentage of Population Employed in Office & Administration in Portland, OR?
Percentage of Population Employed in Office & Administration in Portland is 9.2%.
What is the Percentage of Population Employed in Office & Administration in Oregon?
Percentage of Population Employed in Office & Administration in Oregon is 10.7%.
What is the Percentage of Population Employed in Office & Administration in the United States?
Percentage of Population Employed in Office & Administration in the United States is 10.9%.