Zip Codes with the Highest Percentage of Population with a Degree in Psychology in Portland, OR
RELATED REPORTS & OPTIONS
Psychology
Portland
Compare Zip Codes
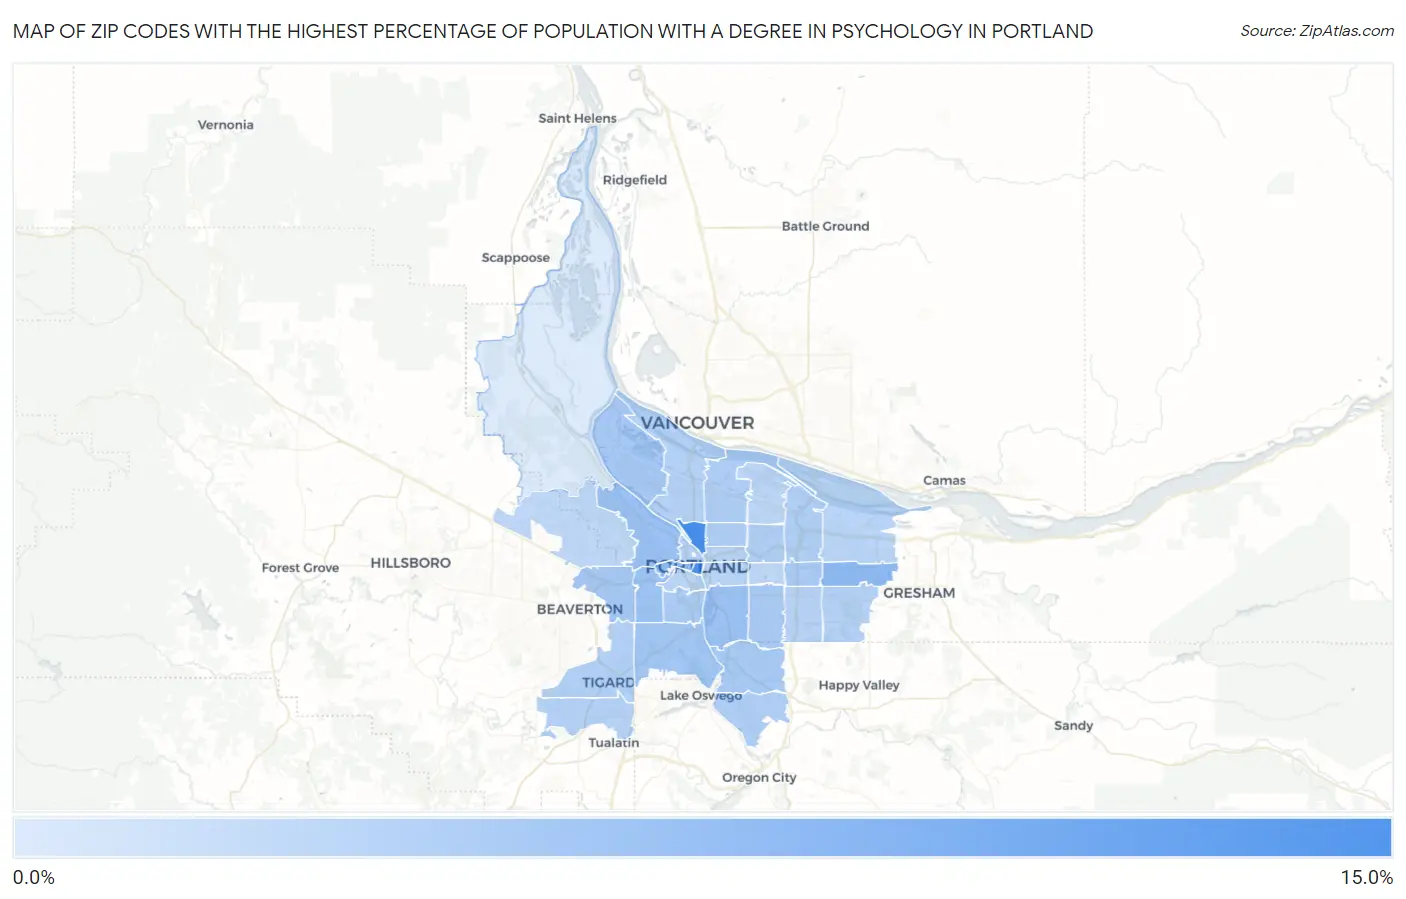
Map of Zip Codes with the Highest Percentage of Population with a Degree in Psychology in Portland
1.7%
14.6%
Zip Codes with the Highest Percentage of Population with a Degree in Psychology in Portland, OR
| Zip Code | % Graduates | vs State | vs National | |
| 1. | 97227 | 14.6% | 5.9%(+8.76)#19 | 5.1%(+9.60)#1,179 |
| 2. | 97204 | 14.3% | 5.9%(+8.40)#21 | 5.1%(+9.23)#1,228 |
| 3. | 97233 | 8.3% | 5.9%(+2.38)#65 | 5.1%(+3.22)#3,837 |
| 4. | 97205 | 8.1% | 5.9%(+2.19)#70 | 5.1%(+3.03)#4,040 |
| 5. | 97202 | 7.3% | 5.9%(+1.36)#86 | 5.1%(+2.20)#5,212 |
| 6. | 97210 | 7.1% | 5.9%(+1.20)#92 | 5.1%(+2.04)#5,483 |
| 7. | 97221 | 6.8% | 5.9%(+0.894)#102 | 5.1%(+1.73)#6,042 |
| 8. | 97219 | 6.5% | 5.9%(+0.579)#116 | 5.1%(+1.42)#6,719 |
| 9. | 97203 | 6.2% | 5.9%(+0.350)#125 | 5.1%(+1.19)#7,280 |
| 10. | 97225 | 6.2% | 5.9%(+0.332)#126 | 5.1%(+1.17)#7,313 |
| 11. | 97222 | 6.1% | 5.9%(+0.211)#128 | 5.1%(+1.05)#7,660 |
| 12. | 97216 | 5.9% | 5.9%(+0.016)#137 | 5.1%(+0.855)#8,242 |
| 13. | 97206 | 5.8% | 5.9%(-0.075)#139 | 5.1%(+0.764)#8,527 |
| 14. | 97239 | 5.8% | 5.9%(-0.099)#141 | 5.1%(+0.740)#8,606 |
| 15. | 97212 | 5.6% | 5.9%(-0.313)#150 | 5.1%(+0.526)#9,258 |
| 16. | 97267 | 5.6% | 5.9%(-0.337)#152 | 5.1%(+0.502)#9,360 |
| 17. | 97211 | 5.5% | 5.9%(-0.348)#153 | 5.1%(+0.492)#9,388 |
| 18. | 97220 | 5.3% | 5.9%(-0.548)#157 | 5.1%(+0.291)#10,023 |
| 19. | 97213 | 5.2% | 5.9%(-0.678)#160 | 5.1%(+0.161)#10,489 |
| 20. | 97223 | 5.2% | 5.9%(-0.693)#162 | 5.1%(+0.146)#10,543 |
| 21. | 97209 | 5.1% | 5.9%(-0.828)#170 | 5.1%(+0.011)#11,035 |
| 22. | 97236 | 4.9% | 5.9%(-0.985)#182 | 5.1%(-0.146)#11,618 |
| 23. | 97217 | 4.9% | 5.9%(-0.995)#184 | 5.1%(-0.156)#11,643 |
| 24. | 97224 | 4.9% | 5.9%(-1.01)#185 | 5.1%(-0.166)#11,676 |
| 25. | 97232 | 4.8% | 5.9%(-1.12)#192 | 5.1%(-0.281)#12,054 |
| 26. | 97266 | 4.6% | 5.9%(-1.26)#195 | 5.1%(-0.417)#12,576 |
| 27. | 97201 | 4.6% | 5.9%(-1.29)#197 | 5.1%(-0.449)#12,706 |
| 28. | 97214 | 4.6% | 5.9%(-1.34)#202 | 5.1%(-0.499)#12,908 |
| 29. | 97230 | 4.5% | 5.9%(-1.35)#204 | 5.1%(-0.509)#12,960 |
| 30. | 97218 | 4.3% | 5.9%(-1.62)#216 | 5.1%(-0.782)#13,965 |
| 31. | 97215 | 4.2% | 5.9%(-1.72)#222 | 5.1%(-0.884)#14,334 |
| 32. | 97229 | 4.1% | 5.9%(-1.77)#226 | 5.1%(-0.929)#14,489 |
| 33. | 97231 | 1.7% | 5.9%(-4.22)#290 | 5.1%(-3.38)#21,490 |
1
Common Questions
What are the Top 10 Zip Codes with the Highest Percentage of Population with a Degree in Psychology in Portland, OR?
Top 10 Zip Codes with the Highest Percentage of Population with a Degree in Psychology in Portland, OR are:
What zip code has the Highest Percentage of Population with a Degree in Psychology in Portland, OR?
97227 has the Highest Percentage of Population with a Degree in Psychology in Portland, OR with 14.6%.
What is the Percentage of Population with a Degree in Psychology in Portland, OR?
Percentage of Population with a Degree in Psychology in Portland is 5.7%.
What is the Percentage of Population with a Degree in Psychology in Oregon?
Percentage of Population with a Degree in Psychology in Oregon is 5.9%.
What is the Percentage of Population with a Degree in Psychology in the United States?
Percentage of Population with a Degree in Psychology in the United States is 5.1%.