Zip Codes with the Highest Percentage of Population Employed in Legal Services & Support in Carson City, NV
RELATED REPORTS & OPTIONS
Legal Services & Support
Carson City
Compare Zip Codes
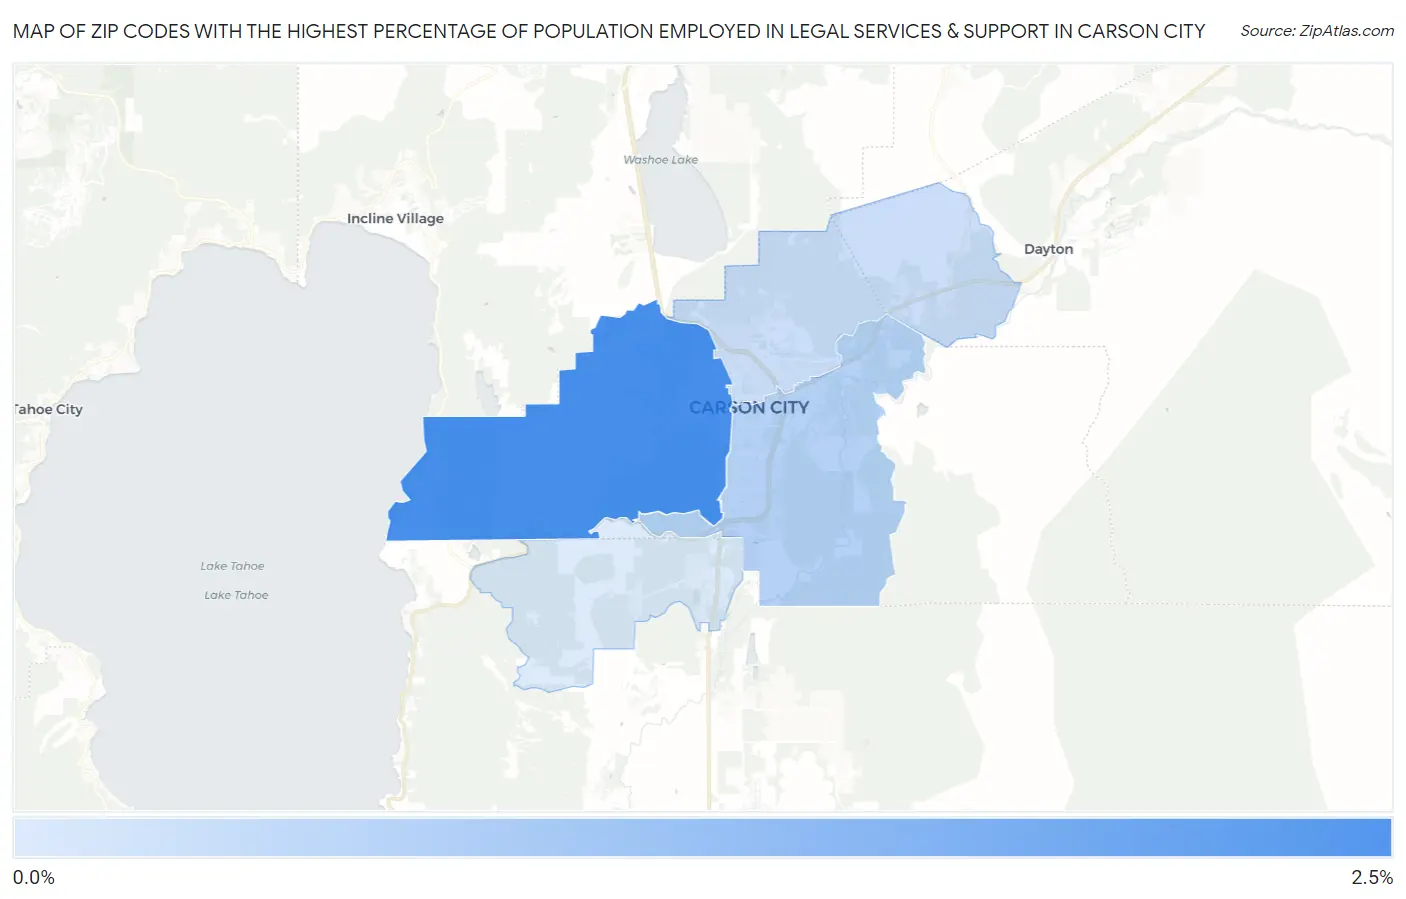
Map of Zip Codes with the Highest Percentage of Population Employed in Legal Services & Support in Carson City
0.20%
2.1%
Zip Codes with the Highest Percentage of Population Employed in Legal Services & Support in Carson City, NV
| Zip Code | % Employed | vs State | vs National | |
| 1. | 89703 | 2.1% | 0.99%(+1.14)#16 | 1.2%(+0.939)#3,190 |
| 2. | 89701 | 0.70% | 0.99%(-0.288)#69 | 1.2%(-0.485)#10,427 |
| 3. | 89706 | 0.44% | 0.99%(-0.551)#85 | 1.2%(-0.748)#13,412 |
| 4. | 89705 | 0.20% | 0.99%(-0.785)#100 | 1.2%(-0.982)#16,179 |
1
Common Questions
What are the Top 3 Zip Codes with the Highest Percentage of Population Employed in Legal Services & Support in Carson City, NV?
Top 3 Zip Codes with the Highest Percentage of Population Employed in Legal Services & Support in Carson City, NV are:
What zip code has the Highest Percentage of Population Employed in Legal Services & Support in Carson City, NV?
89703 has the Highest Percentage of Population Employed in Legal Services & Support in Carson City, NV with 2.1%.
What is the Percentage of Population Employed in Legal Services & Support in Nevada?
Percentage of Population Employed in Legal Services & Support in Nevada is 0.99%.
What is the Percentage of Population Employed in Legal Services & Support in the United States?
Percentage of Population Employed in Legal Services & Support in the United States is 1.2%.