Zip Codes with the Highest Percentage of Population Employed in Legal Services & Support in Warren, MI
RELATED REPORTS & OPTIONS
Legal Services & Support
Warren
Compare Zip Codes
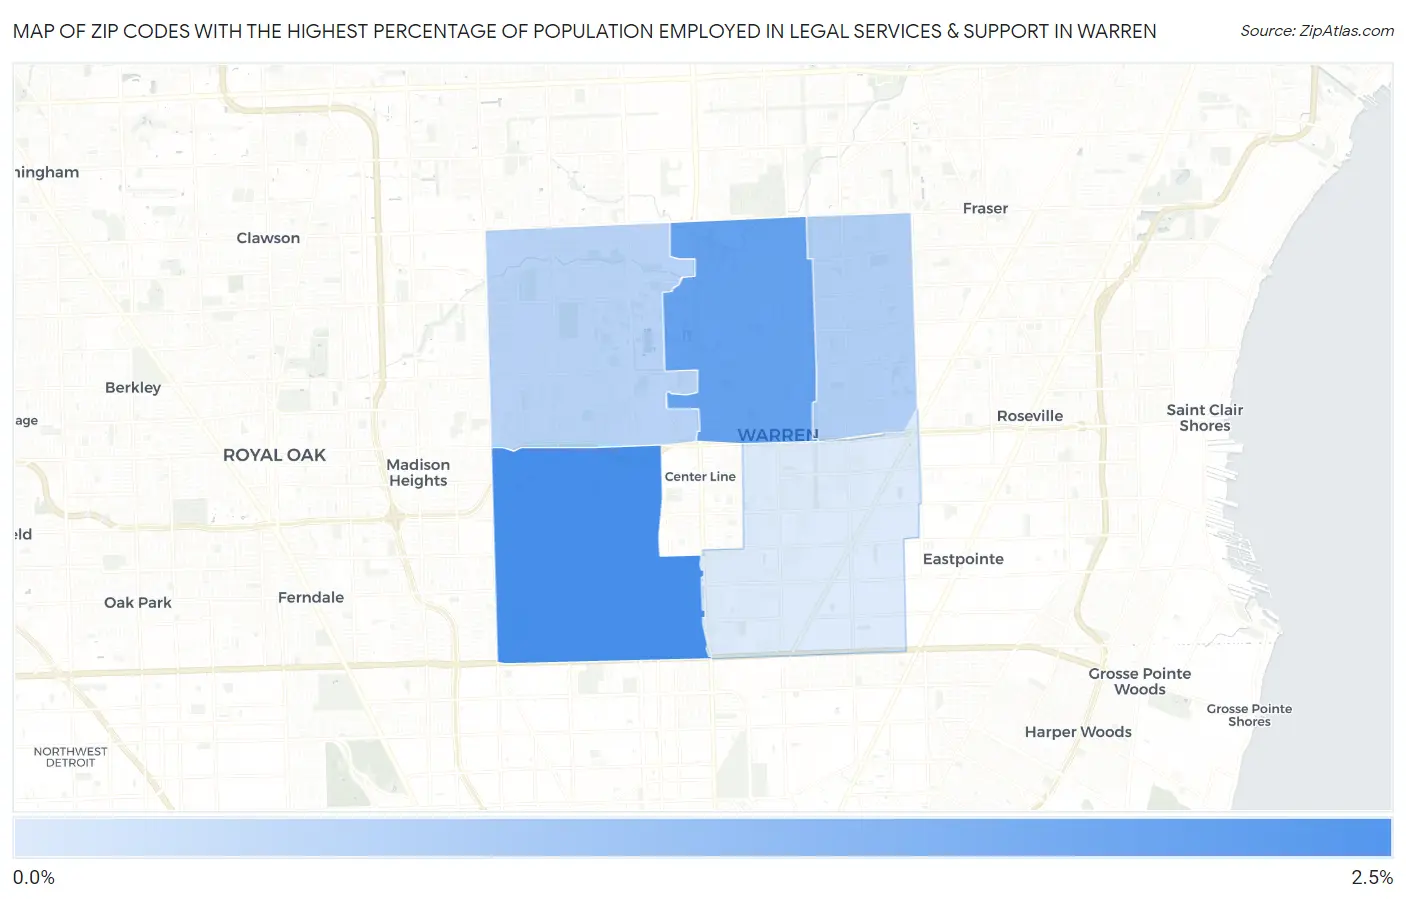
Map of Zip Codes with the Highest Percentage of Population Employed in Legal Services & Support in Warren
0.41%
2.2%
Zip Codes with the Highest Percentage of Population Employed in Legal Services & Support in Warren, MI
| Zip Code | % Employed | vs State | vs National | |
| 1. | 48091 | 2.2% | 0.89%(+1.36)#44 | 1.2%(+1.06)#2,948 |
| 2. | 48093 | 1.9% | 0.89%(+0.976)#64 | 1.2%(+0.678)#3,836 |
| 3. | 48088 | 0.95% | 0.89%(+0.067)#212 | 1.2%(-0.232)#8,195 |
| 4. | 48092 | 0.85% | 0.89%(-0.036)#239 | 1.2%(-0.335)#9,025 |
| 5. | 48089 | 0.41% | 0.89%(-0.475)#427 | 1.2%(-0.773)#13,727 |
1
Common Questions
What are the Top 3 Zip Codes with the Highest Percentage of Population Employed in Legal Services & Support in Warren, MI?
Top 3 Zip Codes with the Highest Percentage of Population Employed in Legal Services & Support in Warren, MI are:
What zip code has the Highest Percentage of Population Employed in Legal Services & Support in Warren, MI?
48091 has the Highest Percentage of Population Employed in Legal Services & Support in Warren, MI with 2.2%.
What is the Percentage of Population Employed in Legal Services & Support in Warren, MI?
Percentage of Population Employed in Legal Services & Support in Warren is 1.2%.
What is the Percentage of Population Employed in Legal Services & Support in Michigan?
Percentage of Population Employed in Legal Services & Support in Michigan is 0.89%.
What is the Percentage of Population Employed in Legal Services & Support in the United States?
Percentage of Population Employed in Legal Services & Support in the United States is 1.2%.