Zip Codes with the Highest Percentage of Population with a Degree in Engineering in Lexington, MA
RELATED REPORTS & OPTIONS
Engineering
Lexington
Compare Zip Codes
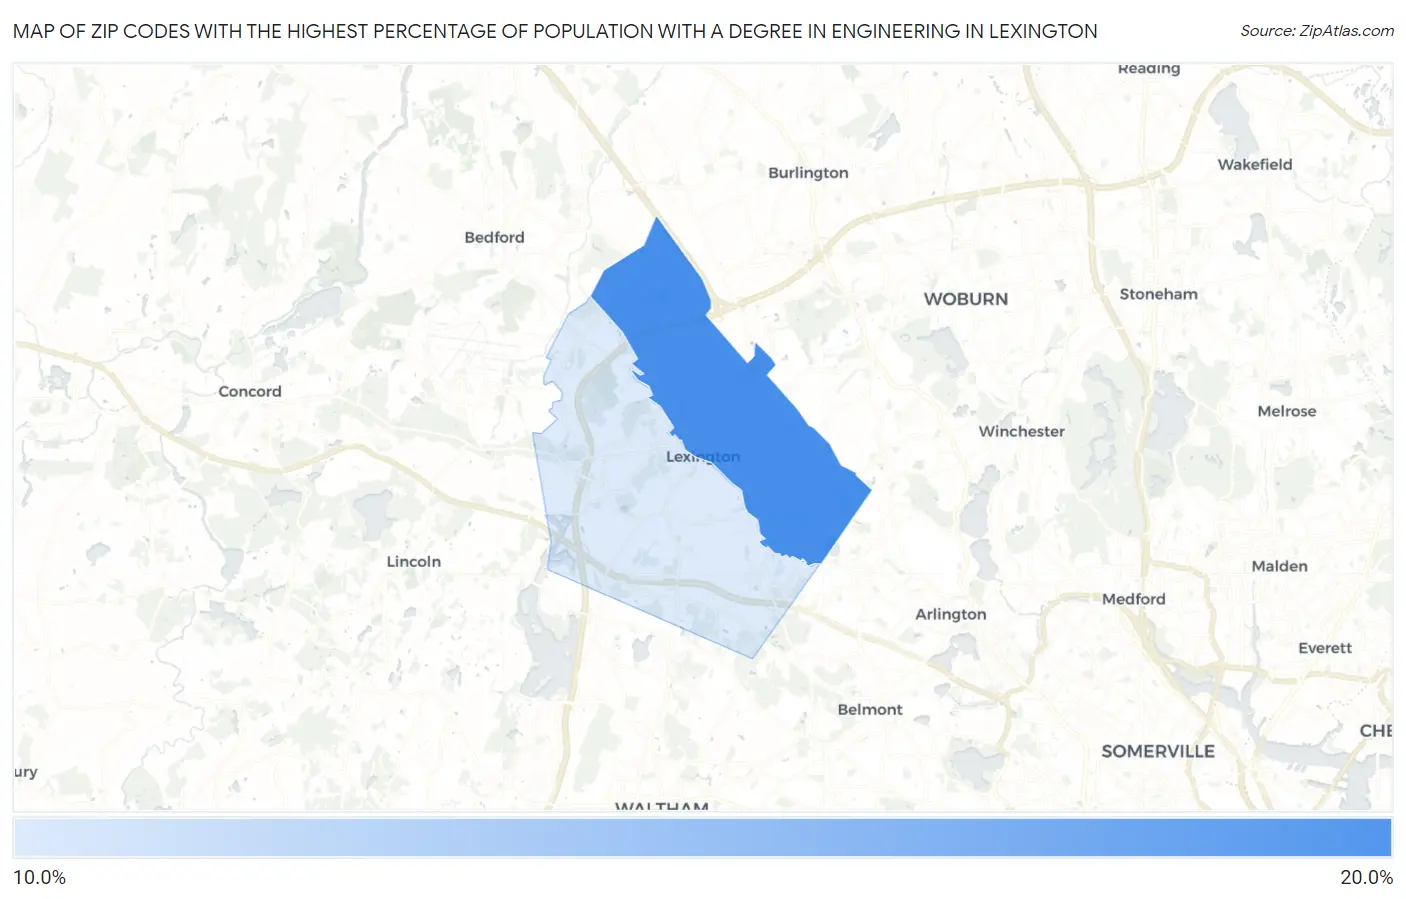
Map of Zip Codes with the Highest Percentage of Population with a Degree in Engineering in Lexington
17.2%
17.6%
Zip Codes with the Highest Percentage of Population with a Degree in Engineering in Lexington, MA
| Zip Code | % Graduates | vs State | vs National | |
| 1. | 02420 | 17.6% | 8.7%(+8.92)#19 | 7.6%(+9.99)#1,205 |
| 2. | 02421 | 17.2% | 8.7%(+8.46)#24 | 7.6%(+9.53)#1,285 |
1
Common Questions
What are the Top Zip Codes with the Highest Percentage of Population with a Degree in Engineering in Lexington, MA?
Top Zip Codes with the Highest Percentage of Population with a Degree in Engineering in Lexington, MA are:
What zip code has the Highest Percentage of Population with a Degree in Engineering in Lexington, MA?
02420 has the Highest Percentage of Population with a Degree in Engineering in Lexington, MA with 17.6%.
What is the Percentage of Population with a Degree in Engineering in Lexington, MA?
Percentage of Population with a Degree in Engineering in Lexington is 17.4%.
What is the Percentage of Population with a Degree in Engineering in Massachusetts?
Percentage of Population with a Degree in Engineering in Massachusetts is 8.7%.
What is the Percentage of Population with a Degree in Engineering in the United States?
Percentage of Population with a Degree in Engineering in the United States is 7.6%.