Uruguayan vs Samoan Wage/Income Gap
COMPARE
Uruguayan
Samoan
Wage/Income Gap
Wage/Income Gap Comparison
Uruguayans
Samoans
25.2%
WAGE/INCOME GAP
81.3/ 100
METRIC RATING
152nd/ 347
METRIC RANK
26.0%
WAGE/INCOME GAP
38.6/ 100
METRIC RATING
179th/ 347
METRIC RANK
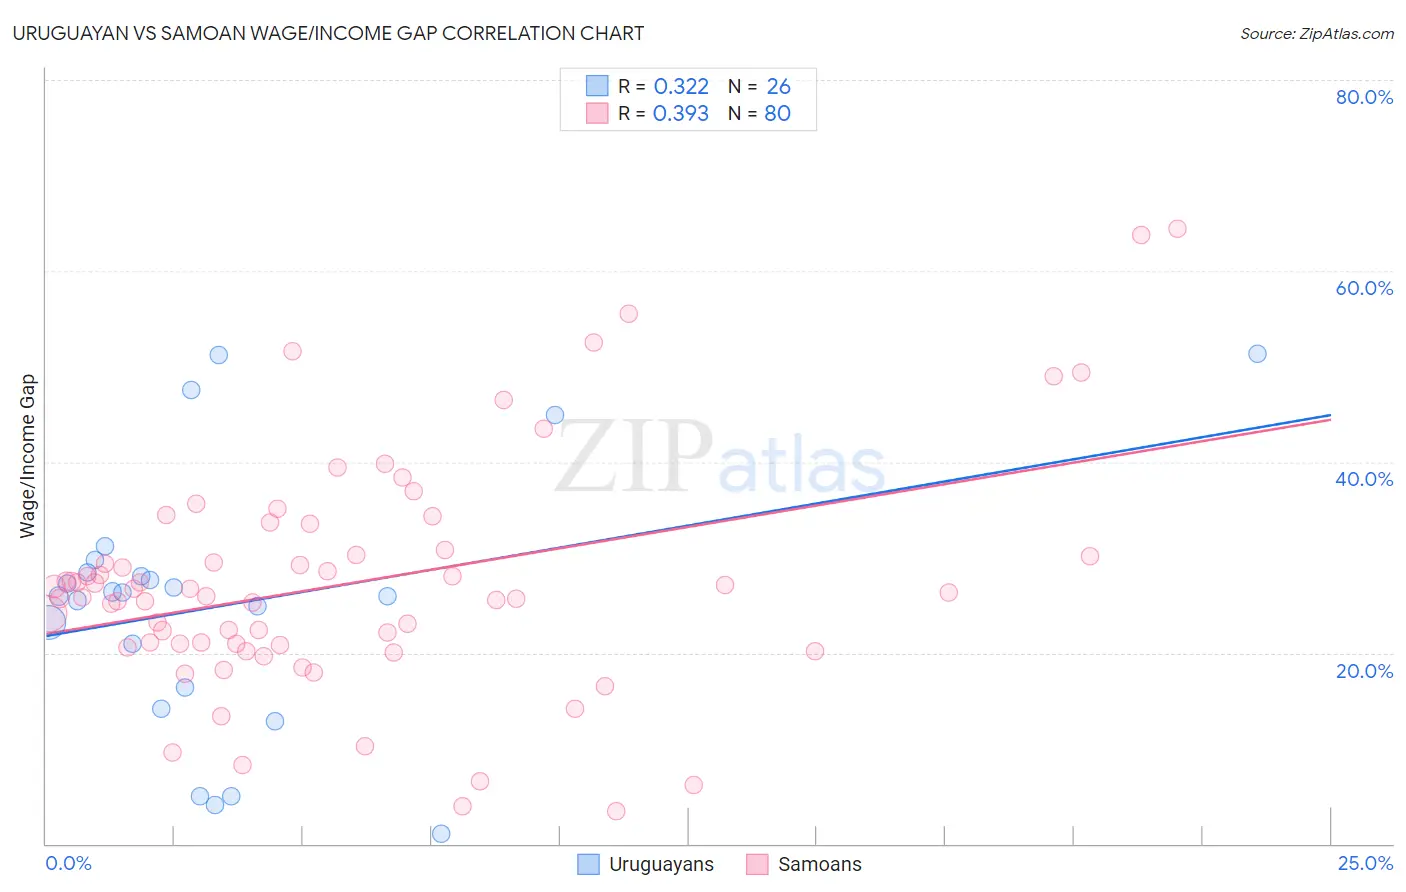
Uruguayan vs Samoan Wage/Income Gap Correlation Chart
The statistical analysis conducted on geographies consisting of 144,770,221 people shows a mild positive correlation between the proportion of Uruguayans and wage/income gap percentage in the United States with a correlation coefficient (R) of 0.322 and weighted average of 25.2%. Similarly, the statistical analysis conducted on geographies consisting of 225,082,264 people shows a mild positive correlation between the proportion of Samoans and wage/income gap percentage in the United States with a correlation coefficient (R) of 0.393 and weighted average of 26.0%, a difference of 3.2%.
Wage/Income Gap Correlation Summary
| Measurement | Uruguayan | Samoan |
| Minimum | 1.1% | 3.4% |
| Maximum | 51.4% | 64.4% |
| Range | 50.3% | 61.0% |
| Mean | 25.1% | 27.4% |
| Median | 26.1% | 26.1% |
| Interquartile 25% (IQ1) | 16.3% | 20.9% |
| Interquartile 75% (IQ3) | 28.4% | 30.5% |
| Interquartile Range (IQR) | 12.1% | 9.6% |
| Standard Deviation (Sample) | 13.5% | 12.1% |
| Standard Deviation (Population) | 13.2% | 12.1% |
Similar Demographics by Wage/Income Gap
Demographics Similar to Uruguayans by Wage/Income Gap
In terms of wage/income gap, the demographic groups most similar to Uruguayans are Taiwanese (25.1%, a difference of 0.030%), Immigrants (25.1%, a difference of 0.11%), Immigrants from Peru (25.1%, a difference of 0.16%), Iroquois (25.1%, a difference of 0.30%), and Blackfeet (25.2%, a difference of 0.32%).
| Demographics | Rating | Rank | Wage/Income Gap |
| Comanche | 85.2 /100 | #145 | Excellent 25.0% |
| South Americans | 85.2 /100 | #146 | Excellent 25.0% |
| Malaysians | 84.9 /100 | #147 | Excellent 25.0% |
| Iroquois | 83.9 /100 | #148 | Excellent 25.1% |
| Immigrants | Peru | 82.6 /100 | #149 | Excellent 25.1% |
| Immigrants | Immigrants | 82.3 /100 | #150 | Excellent 25.1% |
| Taiwanese | 81.6 /100 | #151 | Excellent 25.1% |
| Uruguayans | 81.3 /100 | #152 | Excellent 25.2% |
| Blackfeet | 78.1 /100 | #153 | Good 25.2% |
| Immigrants | Northern Africa | 78.1 /100 | #154 | Good 25.2% |
| Immigrants | Vietnam | 77.7 /100 | #155 | Good 25.2% |
| Immigrants | Mexico | 76.4 /100 | #156 | Good 25.3% |
| Costa Ricans | 75.8 /100 | #157 | Good 25.3% |
| Immigrants | Zimbabwe | 73.7 /100 | #158 | Good 25.3% |
| Puget Sound Salish | 73.0 /100 | #159 | Good 25.3% |
Demographics Similar to Samoans by Wage/Income Gap
In terms of wage/income gap, the demographic groups most similar to Samoans are Guamanian/Chamorro (26.0%, a difference of 0.040%), Immigrants from Bolivia (26.0%, a difference of 0.15%), Chinese (25.9%, a difference of 0.23%), Immigrants from Serbia (26.0%, a difference of 0.23%), and Immigrants from Kazakhstan (26.0%, a difference of 0.24%).
| Demographics | Rating | Rank | Wage/Income Gap |
| Immigrants | Chile | 53.2 /100 | #172 | Average 25.7% |
| Immigrants | Belarus | 52.9 /100 | #173 | Average 25.7% |
| Alaskan Athabascans | 50.0 /100 | #174 | Average 25.8% |
| Sri Lankans | 47.0 /100 | #175 | Average 25.8% |
| Paraguayans | 46.7 /100 | #176 | Average 25.8% |
| Cambodians | 45.1 /100 | #177 | Average 25.8% |
| Chinese | 42.0 /100 | #178 | Average 25.9% |
| Samoans | 38.6 /100 | #179 | Fair 26.0% |
| Guamanians/Chamorros | 38.0 /100 | #180 | Fair 26.0% |
| Immigrants | Bolivia | 36.4 /100 | #181 | Fair 26.0% |
| Immigrants | Serbia | 35.4 /100 | #182 | Fair 26.0% |
| Immigrants | Kazakhstan | 35.2 /100 | #183 | Fair 26.0% |
| Mexicans | 34.4 /100 | #184 | Fair 26.0% |
| Pakistanis | 33.7 /100 | #185 | Fair 26.1% |
| Immigrants | Indonesia | 32.5 /100 | #186 | Fair 26.1% |