Uruguayan vs Dutch Wage/Income Gap
COMPARE
Uruguayan
Dutch
Wage/Income Gap
Wage/Income Gap Comparison
Uruguayans
Dutch
25.2%
WAGE/INCOME GAP
81.3/ 100
METRIC RATING
152nd/ 347
METRIC RANK
29.6%
WAGE/INCOME GAP
0.0/ 100
METRIC RATING
337th/ 347
METRIC RANK
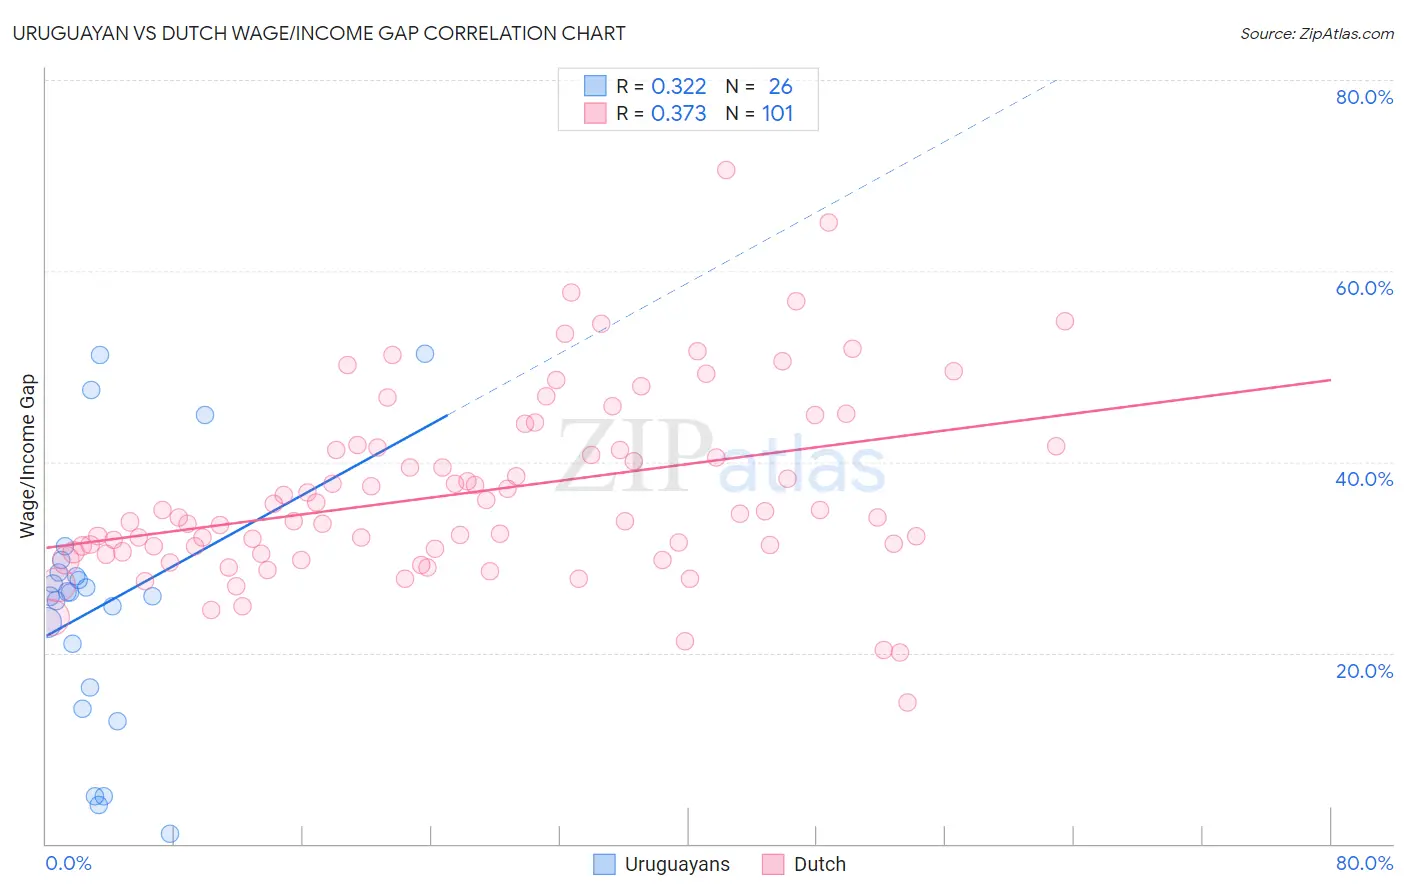
Uruguayan vs Dutch Wage/Income Gap Correlation Chart
The statistical analysis conducted on geographies consisting of 144,770,221 people shows a mild positive correlation between the proportion of Uruguayans and wage/income gap percentage in the United States with a correlation coefficient (R) of 0.322 and weighted average of 25.2%. Similarly, the statistical analysis conducted on geographies consisting of 552,244,152 people shows a mild positive correlation between the proportion of Dutch and wage/income gap percentage in the United States with a correlation coefficient (R) of 0.373 and weighted average of 29.6%, a difference of 17.8%.
Wage/Income Gap Correlation Summary
| Measurement | Uruguayan | Dutch |
| Minimum | 1.1% | 14.8% |
| Maximum | 51.4% | 70.6% |
| Range | 50.3% | 55.8% |
| Mean | 25.1% | 36.8% |
| Median | 26.1% | 34.2% |
| Interquartile 25% (IQ1) | 16.3% | 30.6% |
| Interquartile 75% (IQ3) | 28.4% | 41.5% |
| Interquartile Range (IQR) | 12.1% | 11.0% |
| Standard Deviation (Sample) | 13.5% | 9.7% |
| Standard Deviation (Population) | 13.2% | 9.7% |
Similar Demographics by Wage/Income Gap
Demographics Similar to Uruguayans by Wage/Income Gap
In terms of wage/income gap, the demographic groups most similar to Uruguayans are Taiwanese (25.1%, a difference of 0.030%), Immigrants (25.1%, a difference of 0.11%), Immigrants from Peru (25.1%, a difference of 0.16%), Iroquois (25.1%, a difference of 0.30%), and Blackfeet (25.2%, a difference of 0.32%).
| Demographics | Rating | Rank | Wage/Income Gap |
| Comanche | 85.2 /100 | #145 | Excellent 25.0% |
| South Americans | 85.2 /100 | #146 | Excellent 25.0% |
| Malaysians | 84.9 /100 | #147 | Excellent 25.0% |
| Iroquois | 83.9 /100 | #148 | Excellent 25.1% |
| Immigrants | Peru | 82.6 /100 | #149 | Excellent 25.1% |
| Immigrants | Immigrants | 82.3 /100 | #150 | Excellent 25.1% |
| Taiwanese | 81.6 /100 | #151 | Excellent 25.1% |
| Uruguayans | 81.3 /100 | #152 | Excellent 25.2% |
| Blackfeet | 78.1 /100 | #153 | Good 25.2% |
| Immigrants | Northern Africa | 78.1 /100 | #154 | Good 25.2% |
| Immigrants | Vietnam | 77.7 /100 | #155 | Good 25.2% |
| Immigrants | Mexico | 76.4 /100 | #156 | Good 25.3% |
| Costa Ricans | 75.8 /100 | #157 | Good 25.3% |
| Immigrants | Zimbabwe | 73.7 /100 | #158 | Good 25.3% |
| Puget Sound Salish | 73.0 /100 | #159 | Good 25.3% |
Demographics Similar to Dutch by Wage/Income Gap
In terms of wage/income gap, the demographic groups most similar to Dutch are Filipino (29.7%, a difference of 0.22%), Iranian (29.7%, a difference of 0.28%), English (29.5%, a difference of 0.58%), Immigrants from Taiwan (29.5%, a difference of 0.59%), and Swedish (29.4%, a difference of 0.72%).
| Demographics | Rating | Rank | Wage/Income Gap |
| Germans | 0.0 /100 | #330 | Tragic 29.2% |
| Czechs | 0.0 /100 | #331 | Tragic 29.2% |
| Immigrants | South Central Asia | 0.0 /100 | #332 | Tragic 29.3% |
| Europeans | 0.0 /100 | #333 | Tragic 29.4% |
| Swedes | 0.0 /100 | #334 | Tragic 29.4% |
| Immigrants | Taiwan | 0.0 /100 | #335 | Tragic 29.5% |
| English | 0.0 /100 | #336 | Tragic 29.5% |
| Dutch | 0.0 /100 | #337 | Tragic 29.6% |
| Filipinos | 0.0 /100 | #338 | Tragic 29.7% |
| Iranians | 0.0 /100 | #339 | Tragic 29.7% |
| Swiss | 0.0 /100 | #340 | Tragic 30.0% |
| Thais | 0.0 /100 | #341 | Tragic 30.5% |
| Pennsylvania Germans | 0.0 /100 | #342 | Tragic 30.7% |
| Danes | 0.0 /100 | #343 | Tragic 31.0% |
| Assyrians/Chaldeans/Syriacs | 0.0 /100 | #344 | Tragic 31.0% |