Uruguayan vs Bahamian Wage/Income Gap
COMPARE
Uruguayan
Bahamian
Wage/Income Gap
Wage/Income Gap Comparison
Uruguayans
Bahamians
25.2%
WAGE/INCOME GAP
81.3/ 100
METRIC RATING
152nd/ 347
METRIC RANK
20.2%
WAGE/INCOME GAP
100.0/ 100
METRIC RATING
20th/ 347
METRIC RANK
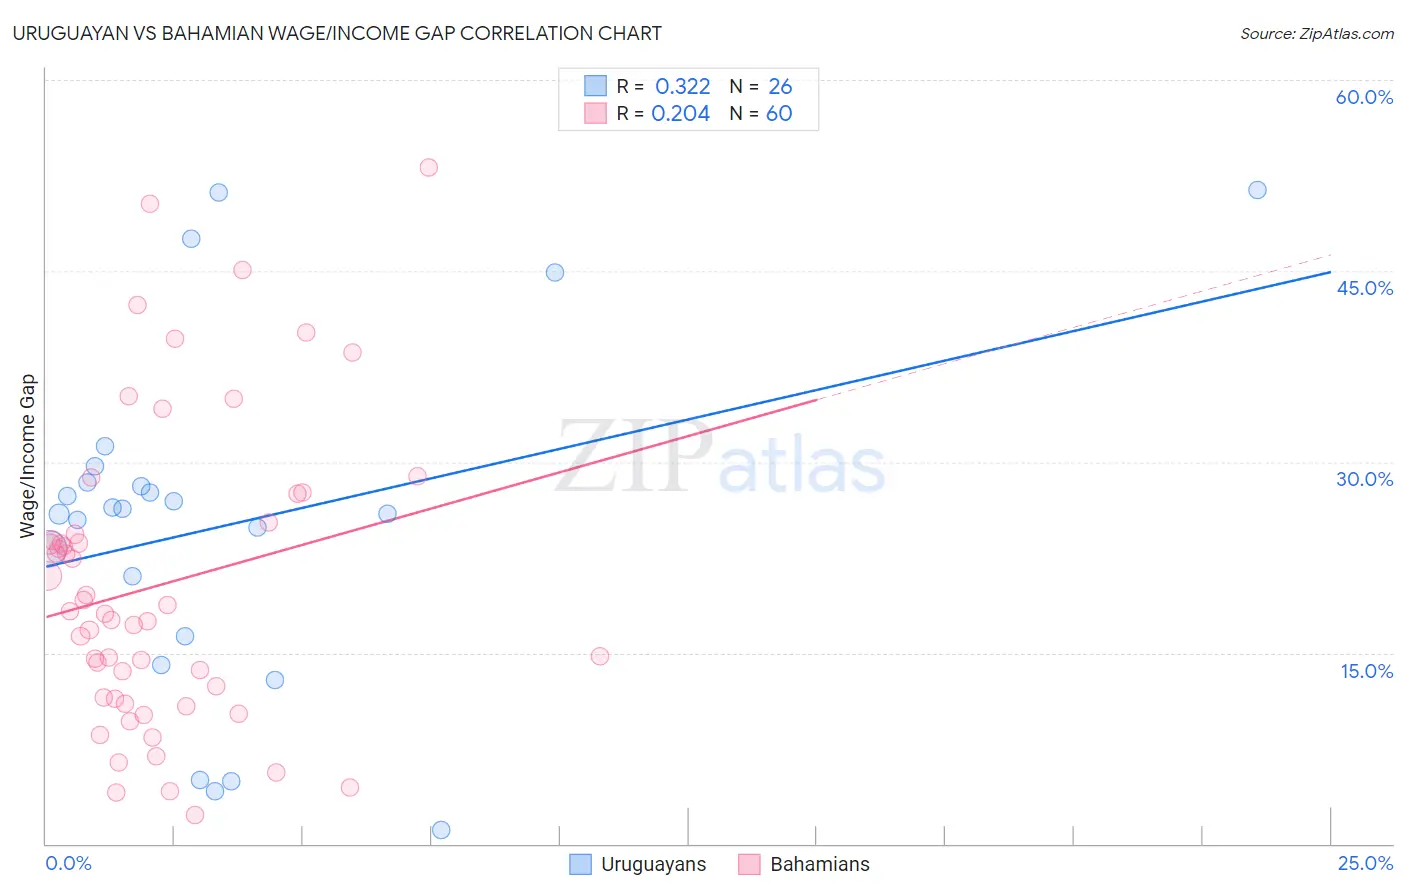
Uruguayan vs Bahamian Wage/Income Gap Correlation Chart
The statistical analysis conducted on geographies consisting of 144,770,221 people shows a mild positive correlation between the proportion of Uruguayans and wage/income gap percentage in the United States with a correlation coefficient (R) of 0.322 and weighted average of 25.2%. Similarly, the statistical analysis conducted on geographies consisting of 112,648,688 people shows a weak positive correlation between the proportion of Bahamians and wage/income gap percentage in the United States with a correlation coefficient (R) of 0.204 and weighted average of 20.2%, a difference of 24.2%.
Wage/Income Gap Correlation Summary
| Measurement | Uruguayan | Bahamian |
| Minimum | 1.1% | 2.2% |
| Maximum | 51.4% | 53.2% |
| Range | 50.3% | 50.9% |
| Mean | 25.1% | 20.4% |
| Median | 26.1% | 18.1% |
| Interquartile 25% (IQ1) | 16.3% | 11.4% |
| Interquartile 75% (IQ3) | 28.4% | 24.8% |
| Interquartile Range (IQR) | 12.1% | 13.4% |
| Standard Deviation (Sample) | 13.5% | 11.8% |
| Standard Deviation (Population) | 13.2% | 11.7% |
Similar Demographics by Wage/Income Gap
Demographics Similar to Uruguayans by Wage/Income Gap
In terms of wage/income gap, the demographic groups most similar to Uruguayans are Taiwanese (25.1%, a difference of 0.030%), Immigrants (25.1%, a difference of 0.11%), Immigrants from Peru (25.1%, a difference of 0.16%), Iroquois (25.1%, a difference of 0.30%), and Blackfeet (25.2%, a difference of 0.32%).
| Demographics | Rating | Rank | Wage/Income Gap |
| Comanche | 85.2 /100 | #145 | Excellent 25.0% |
| South Americans | 85.2 /100 | #146 | Excellent 25.0% |
| Malaysians | 84.9 /100 | #147 | Excellent 25.0% |
| Iroquois | 83.9 /100 | #148 | Excellent 25.1% |
| Immigrants | Peru | 82.6 /100 | #149 | Excellent 25.1% |
| Immigrants | Immigrants | 82.3 /100 | #150 | Excellent 25.1% |
| Taiwanese | 81.6 /100 | #151 | Excellent 25.1% |
| Uruguayans | 81.3 /100 | #152 | Excellent 25.2% |
| Blackfeet | 78.1 /100 | #153 | Good 25.2% |
| Immigrants | Northern Africa | 78.1 /100 | #154 | Good 25.2% |
| Immigrants | Vietnam | 77.7 /100 | #155 | Good 25.2% |
| Immigrants | Mexico | 76.4 /100 | #156 | Good 25.3% |
| Costa Ricans | 75.8 /100 | #157 | Good 25.3% |
| Immigrants | Zimbabwe | 73.7 /100 | #158 | Good 25.3% |
| Puget Sound Salish | 73.0 /100 | #159 | Good 25.3% |
Demographics Similar to Bahamians by Wage/Income Gap
In terms of wage/income gap, the demographic groups most similar to Bahamians are Immigrants from Caribbean (20.4%, a difference of 0.72%), Immigrants from Dominica (20.0%, a difference of 1.1%), Hopi (20.0%, a difference of 1.2%), Immigrants from Liberia (20.6%, a difference of 1.5%), and Immigrants from Dominican Republic (20.6%, a difference of 1.5%).
| Demographics | Rating | Rank | Wage/Income Gap |
| Trinidadians and Tobagonians | 100.0 /100 | #13 | Exceptional 19.3% |
| Immigrants | Trinidad and Tobago | 100.0 /100 | #14 | Exceptional 19.3% |
| West Indians | 100.0 /100 | #15 | Exceptional 19.6% |
| Jamaicans | 100.0 /100 | #16 | Exceptional 19.6% |
| Haitians | 100.0 /100 | #17 | Exceptional 19.7% |
| Hopi | 100.0 /100 | #18 | Exceptional 20.0% |
| Immigrants | Dominica | 100.0 /100 | #19 | Exceptional 20.0% |
| Bahamians | 100.0 /100 | #20 | Exceptional 20.2% |
| Immigrants | Caribbean | 100.0 /100 | #21 | Exceptional 20.4% |
| Immigrants | Liberia | 100.0 /100 | #22 | Exceptional 20.6% |
| Immigrants | Dominican Republic | 100.0 /100 | #23 | Exceptional 20.6% |
| Dominicans | 100.0 /100 | #24 | Exceptional 20.6% |
| Senegalese | 100.0 /100 | #25 | Exceptional 20.7% |
| Pueblo | 100.0 /100 | #26 | Exceptional 20.7% |
| Immigrants | Armenia | 100.0 /100 | #27 | Exceptional 20.7% |