Greek vs Samoan Wage/Income Gap
COMPARE
Greek
Samoan
Wage/Income Gap
Wage/Income Gap Comparison
Greeks
Samoans
28.2%
WAGE/INCOME GAP
0.3/ 100
METRIC RATING
294th/ 347
METRIC RANK
26.0%
WAGE/INCOME GAP
38.6/ 100
METRIC RATING
179th/ 347
METRIC RANK
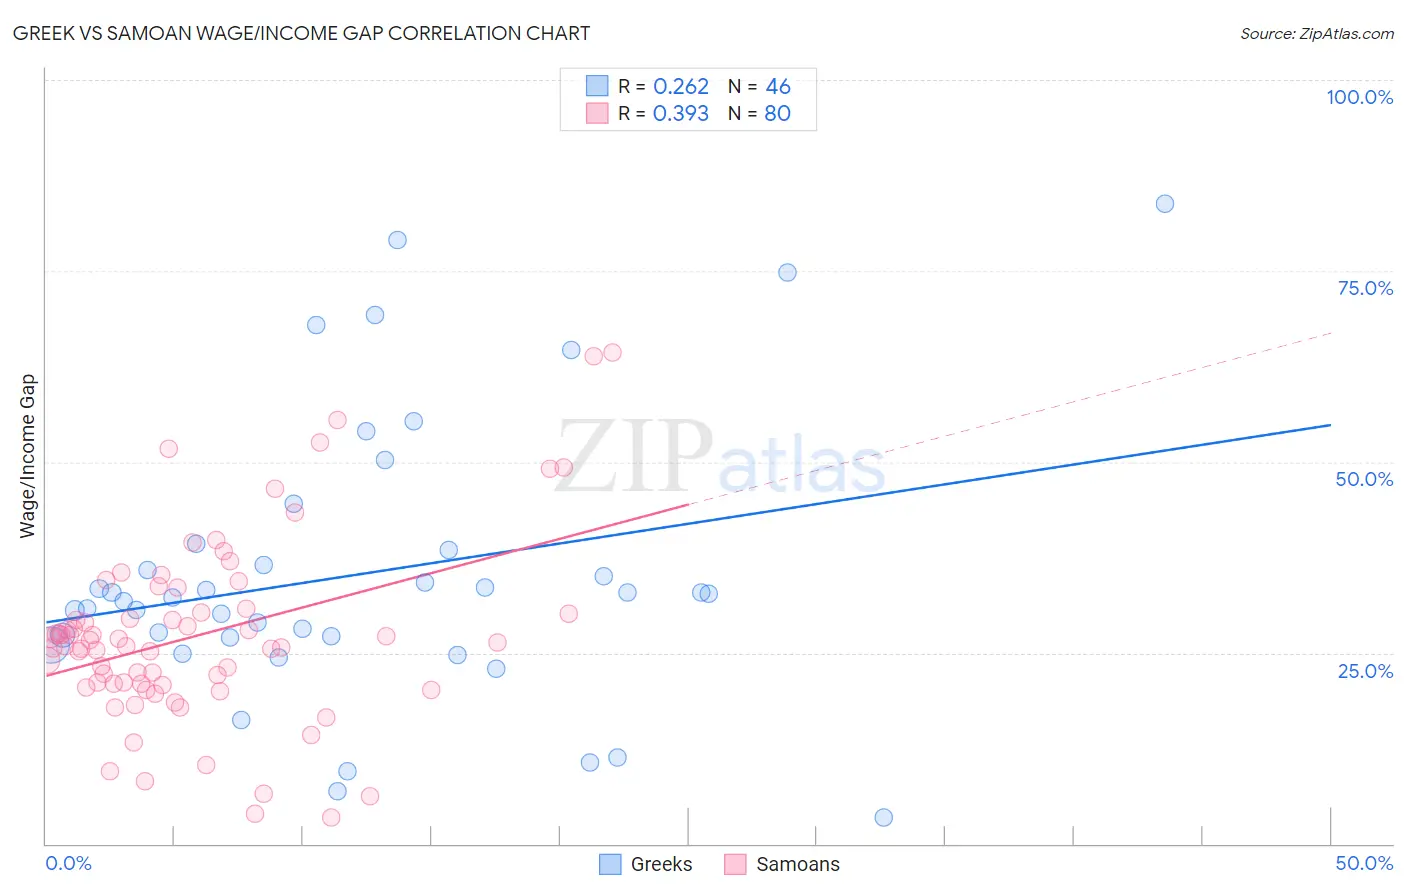
Greek vs Samoan Wage/Income Gap Correlation Chart
The statistical analysis conducted on geographies consisting of 482,094,899 people shows a weak positive correlation between the proportion of Greeks and wage/income gap percentage in the United States with a correlation coefficient (R) of 0.262 and weighted average of 28.2%. Similarly, the statistical analysis conducted on geographies consisting of 225,082,264 people shows a mild positive correlation between the proportion of Samoans and wage/income gap percentage in the United States with a correlation coefficient (R) of 0.393 and weighted average of 26.0%, a difference of 8.8%.
Wage/Income Gap Correlation Summary
| Measurement | Greek | Samoan |
| Minimum | 3.5% | 3.4% |
| Maximum | 83.8% | 64.4% |
| Range | 80.3% | 61.0% |
| Mean | 35.4% | 27.4% |
| Median | 32.4% | 26.1% |
| Interquartile 25% (IQ1) | 27.0% | 20.9% |
| Interquartile 75% (IQ3) | 38.5% | 30.5% |
| Interquartile Range (IQR) | 11.5% | 9.6% |
| Standard Deviation (Sample) | 18.3% | 12.1% |
| Standard Deviation (Population) | 18.1% | 12.1% |
Similar Demographics by Wage/Income Gap
Demographics Similar to Greeks by Wage/Income Gap
In terms of wage/income gap, the demographic groups most similar to Greeks are Immigrants from Israel (28.2%, a difference of 0.020%), Immigrants from Australia (28.2%, a difference of 0.13%), Slovene (28.3%, a difference of 0.13%), Northern European (28.3%, a difference of 0.13%), and Czechoslovakian (28.2%, a difference of 0.19%).
| Demographics | Rating | Rank | Wage/Income Gap |
| Okinawans | 0.4 /100 | #287 | Tragic 28.1% |
| Choctaw | 0.4 /100 | #288 | Tragic 28.1% |
| Canadians | 0.3 /100 | #289 | Tragic 28.1% |
| Australians | 0.3 /100 | #290 | Tragic 28.2% |
| Czechoslovakians | 0.3 /100 | #291 | Tragic 28.2% |
| Immigrants | Australia | 0.3 /100 | #292 | Tragic 28.2% |
| Immigrants | Israel | 0.3 /100 | #293 | Tragic 28.2% |
| Greeks | 0.3 /100 | #294 | Tragic 28.2% |
| Slovenes | 0.3 /100 | #295 | Tragic 28.3% |
| Northern Europeans | 0.3 /100 | #296 | Tragic 28.3% |
| Immigrants | North America | 0.2 /100 | #297 | Tragic 28.4% |
| Austrians | 0.2 /100 | #298 | Tragic 28.4% |
| Immigrants | North Macedonia | 0.2 /100 | #299 | Tragic 28.4% |
| Immigrants | Northern Europe | 0.2 /100 | #300 | Tragic 28.5% |
| Immigrants | Canada | 0.2 /100 | #301 | Tragic 28.5% |
Demographics Similar to Samoans by Wage/Income Gap
In terms of wage/income gap, the demographic groups most similar to Samoans are Guamanian/Chamorro (26.0%, a difference of 0.040%), Immigrants from Bolivia (26.0%, a difference of 0.15%), Chinese (25.9%, a difference of 0.23%), Immigrants from Serbia (26.0%, a difference of 0.23%), and Immigrants from Kazakhstan (26.0%, a difference of 0.24%).
| Demographics | Rating | Rank | Wage/Income Gap |
| Immigrants | Chile | 53.2 /100 | #172 | Average 25.7% |
| Immigrants | Belarus | 52.9 /100 | #173 | Average 25.7% |
| Alaskan Athabascans | 50.0 /100 | #174 | Average 25.8% |
| Sri Lankans | 47.0 /100 | #175 | Average 25.8% |
| Paraguayans | 46.7 /100 | #176 | Average 25.8% |
| Cambodians | 45.1 /100 | #177 | Average 25.8% |
| Chinese | 42.0 /100 | #178 | Average 25.9% |
| Samoans | 38.6 /100 | #179 | Fair 26.0% |
| Guamanians/Chamorros | 38.0 /100 | #180 | Fair 26.0% |
| Immigrants | Bolivia | 36.4 /100 | #181 | Fair 26.0% |
| Immigrants | Serbia | 35.4 /100 | #182 | Fair 26.0% |
| Immigrants | Kazakhstan | 35.2 /100 | #183 | Fair 26.0% |
| Mexicans | 34.4 /100 | #184 | Fair 26.0% |
| Pakistanis | 33.7 /100 | #185 | Fair 26.1% |
| Immigrants | Indonesia | 32.5 /100 | #186 | Fair 26.1% |