Chinese vs Immigrants from Hong Kong Wage/Income Gap
COMPARE
Chinese
Immigrants from Hong Kong
Wage/Income Gap
Wage/Income Gap Comparison
Chinese
Immigrants from Hong Kong
25.9%
WAGE/INCOME GAP
42.0/ 100
METRIC RATING
178th/ 347
METRIC RANK
25.5%
WAGE/INCOME GAP
64.0/ 100
METRIC RATING
165th/ 347
METRIC RANK
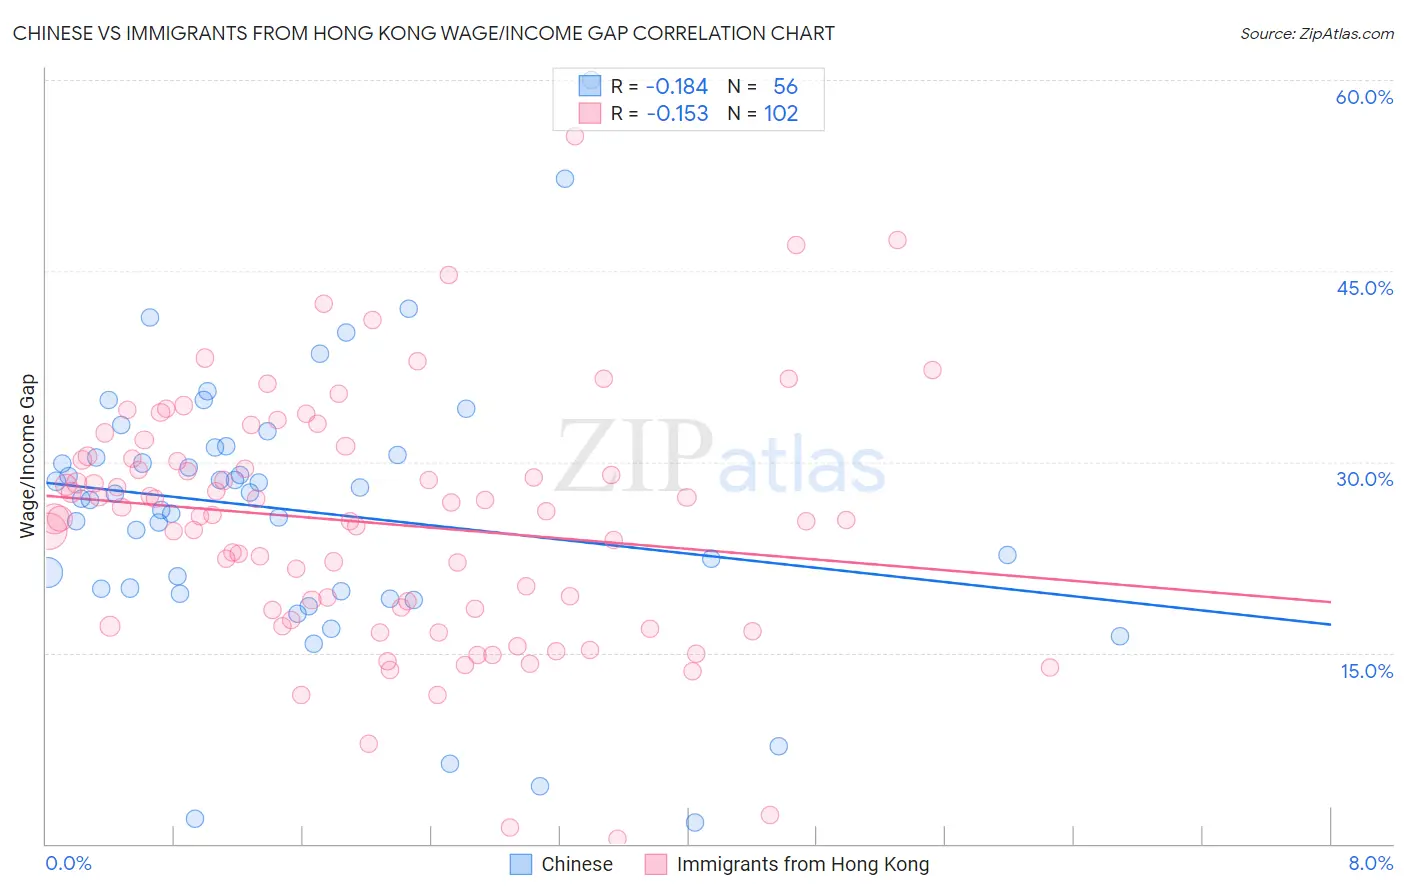
Chinese vs Immigrants from Hong Kong Wage/Income Gap Correlation Chart
The statistical analysis conducted on geographies consisting of 64,807,074 people shows a poor negative correlation between the proportion of Chinese and wage/income gap percentage in the United States with a correlation coefficient (R) of -0.184 and weighted average of 25.9%. Similarly, the statistical analysis conducted on geographies consisting of 253,936,651 people shows a poor negative correlation between the proportion of Immigrants from Hong Kong and wage/income gap percentage in the United States with a correlation coefficient (R) of -0.153 and weighted average of 25.5%, a difference of 1.5%.
Wage/Income Gap Correlation Summary
| Measurement | Chinese | Immigrants from Hong Kong |
| Minimum | 1.7% | 0.36% |
| Maximum | 60.0% | 55.6% |
| Range | 58.3% | 55.2% |
| Mean | 26.2% | 25.2% |
| Median | 27.3% | 25.8% |
| Interquartile 25% (IQ1) | 19.9% | 18.3% |
| Interquartile 75% (IQ3) | 30.9% | 30.3% |
| Interquartile Range (IQR) | 10.9% | 11.9% |
| Standard Deviation (Sample) | 10.8% | 9.6% |
| Standard Deviation (Population) | 10.7% | 9.6% |
Demographics Similar to Chinese and Immigrants from Hong Kong by Wage/Income Gap
In terms of wage/income gap, the demographic groups most similar to Chinese are Cambodian (25.8%, a difference of 0.21%), Samoan (26.0%, a difference of 0.23%), Guamanian/Chamorro (26.0%, a difference of 0.27%), Paraguayan (25.8%, a difference of 0.32%), and Sri Lankan (25.8%, a difference of 0.33%). Similarly, the demographic groups most similar to Immigrants from Hong Kong are Immigrants from Ukraine (25.5%, a difference of 0.010%), Paiute (25.5%, a difference of 0.070%), Seminole (25.6%, a difference of 0.090%), Peruvian (25.6%, a difference of 0.27%), and Korean (25.4%, a difference of 0.34%).
| Demographics | Rating | Rank | Wage/Income Gap |
| Albanians | 69.4 /100 | #161 | Good 25.4% |
| Shoshone | 69.0 /100 | #162 | Good 25.4% |
| Native Hawaiians | 69.0 /100 | #163 | Good 25.4% |
| Koreans | 68.6 /100 | #164 | Good 25.4% |
| Immigrants | Hong Kong | 64.0 /100 | #165 | Good 25.5% |
| Immigrants | Ukraine | 63.8 /100 | #166 | Good 25.5% |
| Paiute | 62.9 /100 | #167 | Good 25.5% |
| Seminole | 62.6 /100 | #168 | Good 25.6% |
| Peruvians | 60.1 /100 | #169 | Good 25.6% |
| Immigrants | Oceania | 57.5 /100 | #170 | Average 25.6% |
| Immigrants | Greece | 56.6 /100 | #171 | Average 25.7% |
| Immigrants | Chile | 53.2 /100 | #172 | Average 25.7% |
| Immigrants | Belarus | 52.9 /100 | #173 | Average 25.7% |
| Alaskan Athabascans | 50.0 /100 | #174 | Average 25.8% |
| Sri Lankans | 47.0 /100 | #175 | Average 25.8% |
| Paraguayans | 46.7 /100 | #176 | Average 25.8% |
| Cambodians | 45.1 /100 | #177 | Average 25.8% |
| Chinese | 42.0 /100 | #178 | Average 25.9% |
| Samoans | 38.6 /100 | #179 | Fair 26.0% |
| Guamanians/Chamorros | 38.0 /100 | #180 | Fair 26.0% |
| Immigrants | Bolivia | 36.4 /100 | #181 | Fair 26.0% |