Trinidadian and Tobagonian vs Immigrants from Hong Kong Seniors Poverty Over the Age of 75
COMPARE
Trinidadian and Tobagonian
Immigrants from Hong Kong
Seniors Poverty Over the Age of 75
Seniors Poverty Over the Age of 75 Comparison
Trinidadians and Tobagonians
Immigrants from Hong Kong
15.9%
SENIORS POVERTY OVER THE AGE OF 75
0.0/ 100
METRIC RATING
311th/ 347
METRIC RANK
12.8%
SENIORS POVERTY OVER THE AGE OF 75
6.5/ 100
METRIC RATING
212th/ 347
METRIC RANK
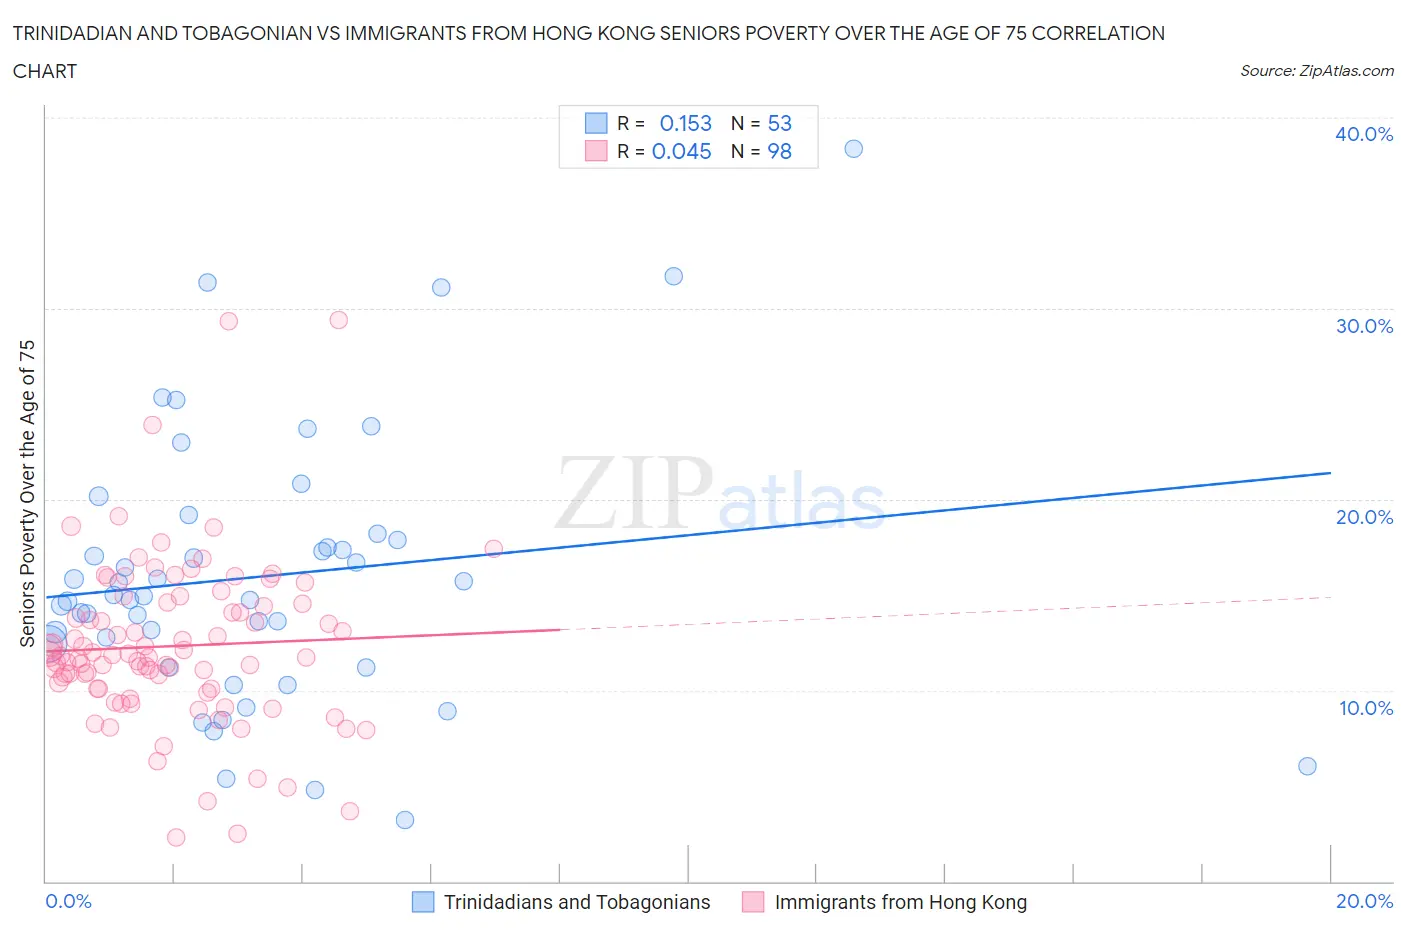
Trinidadian and Tobagonian vs Immigrants from Hong Kong Seniors Poverty Over the Age of 75 Correlation Chart
The statistical analysis conducted on geographies consisting of 218,354,994 people shows a poor positive correlation between the proportion of Trinidadians and Tobagonians and poverty level among seniors over the age of 75 in the United States with a correlation coefficient (R) of 0.153 and weighted average of 15.9%. Similarly, the statistical analysis conducted on geographies consisting of 252,162,249 people shows no correlation between the proportion of Immigrants from Hong Kong and poverty level among seniors over the age of 75 in the United States with a correlation coefficient (R) of 0.045 and weighted average of 12.8%, a difference of 23.6%.
Seniors Poverty Over the Age of 75 Correlation Summary
| Measurement | Trinidadian and Tobagonian | Immigrants from Hong Kong |
| Minimum | 3.2% | 2.3% |
| Maximum | 38.3% | 29.4% |
| Range | 35.1% | 27.1% |
| Mean | 16.0% | 12.3% |
| Median | 14.9% | 11.8% |
| Interquartile 25% (IQ1) | 11.8% | 10.1% |
| Interquartile 75% (IQ3) | 18.0% | 14.5% |
| Interquartile Range (IQR) | 6.2% | 4.4% |
| Standard Deviation (Sample) | 7.0% | 4.4% |
| Standard Deviation (Population) | 7.0% | 4.4% |
Similar Demographics by Seniors Poverty Over the Age of 75
Demographics Similar to Trinidadians and Tobagonians by Seniors Poverty Over the Age of 75
In terms of seniors poverty over the age of 75, the demographic groups most similar to Trinidadians and Tobagonians are Vietnamese (15.9%, a difference of 0.10%), Yup'ik (15.8%, a difference of 0.20%), Crow (15.9%, a difference of 0.41%), Immigrants from Bangladesh (15.8%, a difference of 0.50%), and Immigrants from West Indies (15.8%, a difference of 0.55%).
| Demographics | Rating | Rank | Seniors Poverty Over the Age of 75 |
| Immigrants | Trinidad and Tobago | 0.0 /100 | #304 | Tragic 15.7% |
| Ecuadorians | 0.0 /100 | #305 | Tragic 15.7% |
| Hispanics or Latinos | 0.0 /100 | #306 | Tragic 15.8% |
| Immigrants | West Indies | 0.0 /100 | #307 | Tragic 15.8% |
| Immigrants | Bangladesh | 0.0 /100 | #308 | Tragic 15.8% |
| Yup'ik | 0.0 /100 | #309 | Tragic 15.8% |
| Vietnamese | 0.0 /100 | #310 | Tragic 15.9% |
| Trinidadians and Tobagonians | 0.0 /100 | #311 | Tragic 15.9% |
| Crow | 0.0 /100 | #312 | Tragic 15.9% |
| Barbadians | 0.0 /100 | #313 | Tragic 16.0% |
| Tsimshian | 0.0 /100 | #314 | Tragic 16.1% |
| Guyanese | 0.0 /100 | #315 | Tragic 16.1% |
| Immigrants | Ecuador | 0.0 /100 | #316 | Tragic 16.1% |
| Immigrants | Guyana | 0.0 /100 | #317 | Tragic 16.2% |
| Houma | 0.0 /100 | #318 | Tragic 16.2% |
Demographics Similar to Immigrants from Hong Kong by Seniors Poverty Over the Age of 75
In terms of seniors poverty over the age of 75, the demographic groups most similar to Immigrants from Hong Kong are Brazilian (12.8%, a difference of 0.13%), Comanche (12.8%, a difference of 0.15%), French American Indian (12.9%, a difference of 0.15%), Immigrants from Africa (12.9%, a difference of 0.22%), and Immigrants from Liberia (12.8%, a difference of 0.25%).
| Demographics | Rating | Rank | Seniors Poverty Over the Age of 75 |
| Indians (Asian) | 9.7 /100 | #205 | Tragic 12.7% |
| Albanians | 9.6 /100 | #206 | Tragic 12.7% |
| Costa Ricans | 8.7 /100 | #207 | Tragic 12.8% |
| Immigrants | Eastern Asia | 8.4 /100 | #208 | Tragic 12.8% |
| Immigrants | Liberia | 7.3 /100 | #209 | Tragic 12.8% |
| Comanche | 7.0 /100 | #210 | Tragic 12.8% |
| Brazilians | 6.9 /100 | #211 | Tragic 12.8% |
| Immigrants | Hong Kong | 6.5 /100 | #212 | Tragic 12.8% |
| French American Indians | 6.1 /100 | #213 | Tragic 12.9% |
| Immigrants | Africa | 5.9 /100 | #214 | Tragic 12.9% |
| South American Indians | 5.5 /100 | #215 | Tragic 12.9% |
| Immigrants | Brazil | 5.2 /100 | #216 | Tragic 12.9% |
| Bermudans | 4.9 /100 | #217 | Tragic 12.9% |
| Immigrants | Western Asia | 4.9 /100 | #218 | Tragic 12.9% |
| Ute | 4.7 /100 | #219 | Tragic 12.9% |