Immigrants from Panama vs Immigrants from Hong Kong Wage/Income Gap
COMPARE
Immigrants from Panama
Immigrants from Hong Kong
Wage/Income Gap
Wage/Income Gap Comparison
Immigrants from Panama
Immigrants from Hong Kong
23.4%
WAGE/INCOME GAP
99.6/ 100
METRIC RATING
88th/ 347
METRIC RANK
25.5%
WAGE/INCOME GAP
64.0/ 100
METRIC RATING
165th/ 347
METRIC RANK
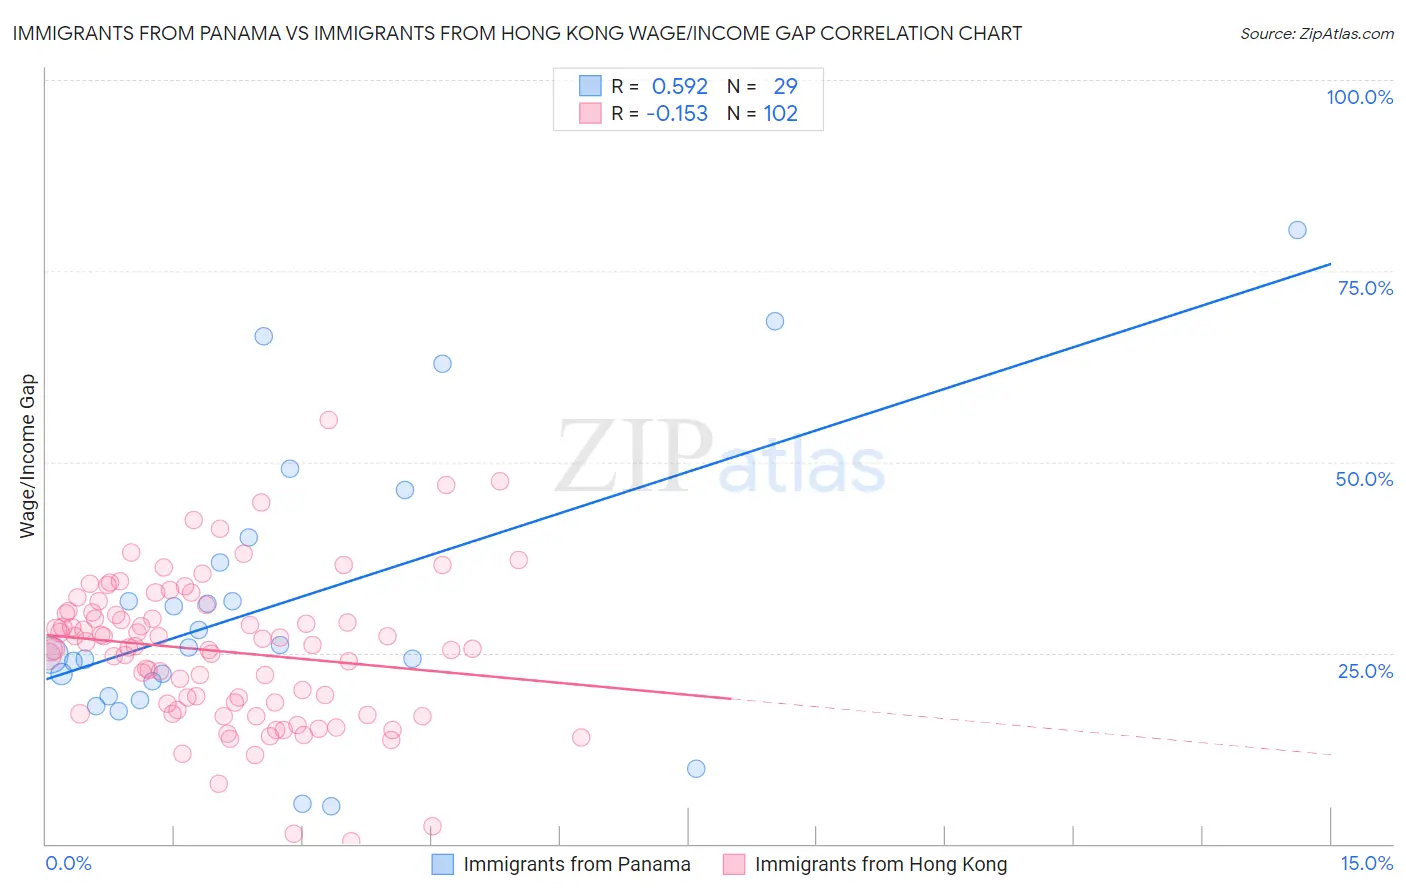
Immigrants from Panama vs Immigrants from Hong Kong Wage/Income Gap Correlation Chart
The statistical analysis conducted on geographies consisting of 221,125,355 people shows a substantial positive correlation between the proportion of Immigrants from Panama and wage/income gap percentage in the United States with a correlation coefficient (R) of 0.592 and weighted average of 23.4%. Similarly, the statistical analysis conducted on geographies consisting of 253,936,651 people shows a poor negative correlation between the proportion of Immigrants from Hong Kong and wage/income gap percentage in the United States with a correlation coefficient (R) of -0.153 and weighted average of 25.5%, a difference of 9.0%.
Wage/Income Gap Correlation Summary
| Measurement | Immigrants from Panama | Immigrants from Hong Kong |
| Minimum | 5.0% | 0.36% |
| Maximum | 80.4% | 55.6% |
| Range | 75.4% | 55.2% |
| Mean | 31.5% | 25.2% |
| Median | 25.7% | 25.8% |
| Interquartile 25% (IQ1) | 20.3% | 18.3% |
| Interquartile 75% (IQ3) | 38.5% | 30.3% |
| Interquartile Range (IQR) | 18.2% | 11.9% |
| Standard Deviation (Sample) | 18.6% | 9.6% |
| Standard Deviation (Population) | 18.3% | 9.6% |
Similar Demographics by Wage/Income Gap
Demographics Similar to Immigrants from Panama by Wage/Income Gap
In terms of wage/income gap, the demographic groups most similar to Immigrants from Panama are Marshallese (23.4%, a difference of 0.090%), Nicaraguan (23.4%, a difference of 0.10%), Arapaho (23.5%, a difference of 0.24%), Yuman (23.3%, a difference of 0.32%), and Cheyenne (23.3%, a difference of 0.37%).
| Demographics | Rating | Rank | Wage/Income Gap |
| Bermudans | 99.8 /100 | #81 | Exceptional 23.1% |
| Central Americans | 99.8 /100 | #82 | Exceptional 23.1% |
| Immigrants | Africa | 99.8 /100 | #83 | Exceptional 23.2% |
| Cubans | 99.7 /100 | #84 | Exceptional 23.3% |
| Immigrants | Cambodia | 99.7 /100 | #85 | Exceptional 23.3% |
| Cheyenne | 99.7 /100 | #86 | Exceptional 23.3% |
| Yuman | 99.7 /100 | #87 | Exceptional 23.3% |
| Immigrants | Panama | 99.6 /100 | #88 | Exceptional 23.4% |
| Marshallese | 99.6 /100 | #89 | Exceptional 23.4% |
| Nicaraguans | 99.6 /100 | #90 | Exceptional 23.4% |
| Arapaho | 99.6 /100 | #91 | Exceptional 23.5% |
| Immigrants | Honduras | 99.5 /100 | #92 | Exceptional 23.5% |
| Immigrants | Cabo Verde | 99.5 /100 | #93 | Exceptional 23.6% |
| Hondurans | 99.5 /100 | #94 | Exceptional 23.6% |
| Cape Verdeans | 99.4 /100 | #95 | Exceptional 23.6% |
Demographics Similar to Immigrants from Hong Kong by Wage/Income Gap
In terms of wage/income gap, the demographic groups most similar to Immigrants from Hong Kong are Immigrants from Ukraine (25.5%, a difference of 0.010%), Paiute (25.5%, a difference of 0.070%), Seminole (25.6%, a difference of 0.090%), Peruvian (25.6%, a difference of 0.27%), and Korean (25.4%, a difference of 0.34%).
| Demographics | Rating | Rank | Wage/Income Gap |
| Immigrants | Zimbabwe | 73.7 /100 | #158 | Good 25.3% |
| Puget Sound Salish | 73.0 /100 | #159 | Good 25.3% |
| French American Indians | 72.5 /100 | #160 | Good 25.4% |
| Albanians | 69.4 /100 | #161 | Good 25.4% |
| Shoshone | 69.0 /100 | #162 | Good 25.4% |
| Native Hawaiians | 69.0 /100 | #163 | Good 25.4% |
| Koreans | 68.6 /100 | #164 | Good 25.4% |
| Immigrants | Hong Kong | 64.0 /100 | #165 | Good 25.5% |
| Immigrants | Ukraine | 63.8 /100 | #166 | Good 25.5% |
| Paiute | 62.9 /100 | #167 | Good 25.5% |
| Seminole | 62.6 /100 | #168 | Good 25.6% |
| Peruvians | 60.1 /100 | #169 | Good 25.6% |
| Immigrants | Oceania | 57.5 /100 | #170 | Average 25.6% |
| Immigrants | Greece | 56.6 /100 | #171 | Average 25.7% |
| Immigrants | Chile | 53.2 /100 | #172 | Average 25.7% |