Scotch-Irish vs Afghan Householder Income Over 65 years
COMPARE
Scotch-Irish
Afghan
Householder Income Over 65 years
Householder Income Over 65 years Comparison
Scotch-Irish
Afghans
$59,447
HOUSEHOLDER INCOME OVER 65 YEARS
16.9/ 100
METRIC RATING
203rd/ 347
METRIC RANK
$68,951
HOUSEHOLDER INCOME OVER 65 YEARS
100.0/ 100
METRIC RATING
31st/ 347
METRIC RANK
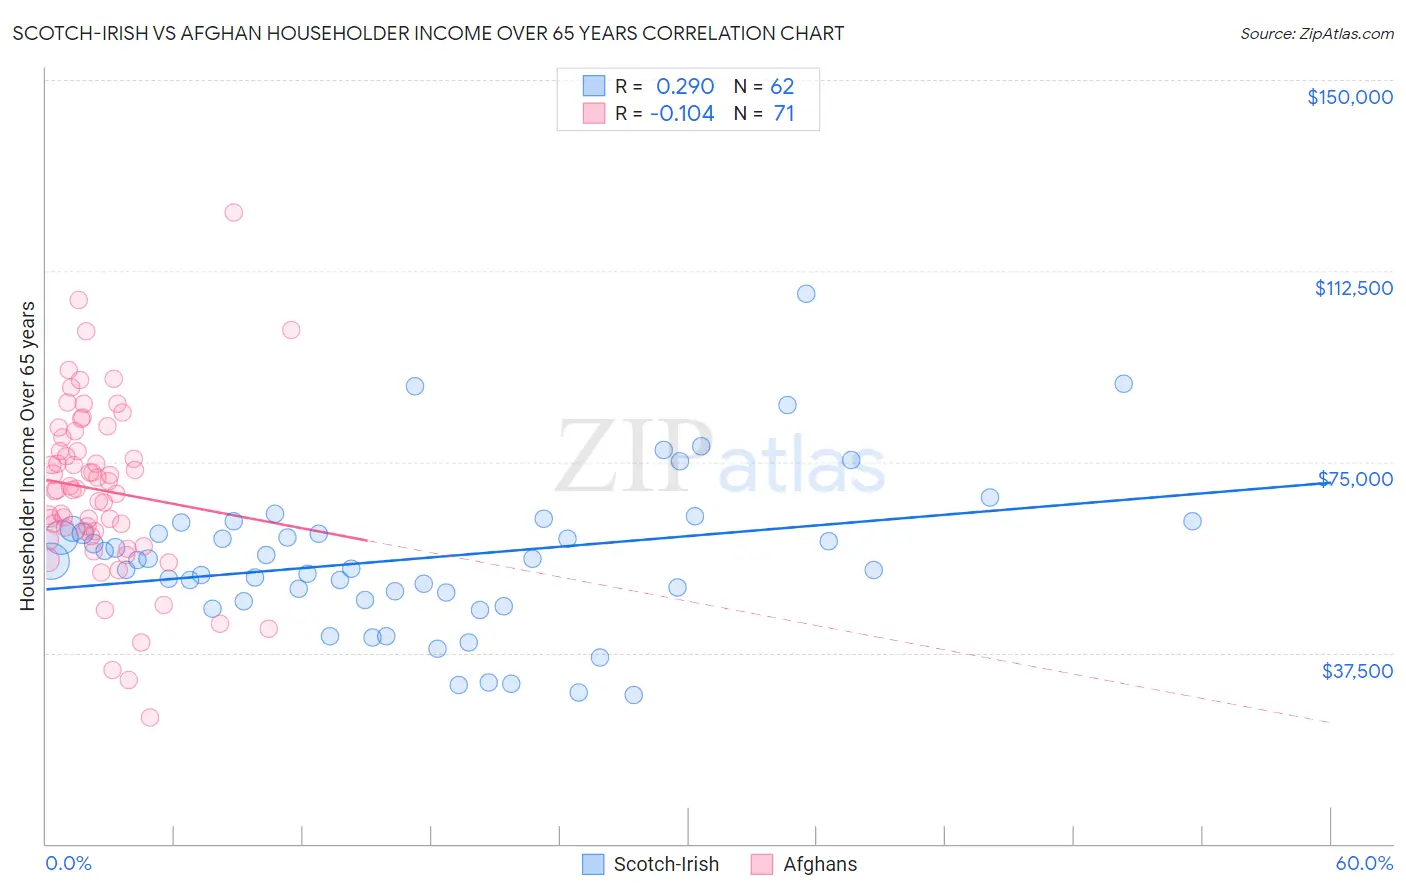
Scotch-Irish vs Afghan Householder Income Over 65 years Correlation Chart
The statistical analysis conducted on geographies consisting of 544,677,827 people shows a weak positive correlation between the proportion of Scotch-Irish and household income with householder over the age of 65 in the United States with a correlation coefficient (R) of 0.290 and weighted average of $59,447. Similarly, the statistical analysis conducted on geographies consisting of 148,636,797 people shows a poor negative correlation between the proportion of Afghans and household income with householder over the age of 65 in the United States with a correlation coefficient (R) of -0.104 and weighted average of $68,951, a difference of 16.0%.
Householder Income Over 65 years Correlation Summary
| Measurement | Scotch-Irish | Afghan |
| Minimum | $29,123 | $24,819 |
| Maximum | $108,125 | $123,958 |
| Range | $79,002 | $99,139 |
| Mean | $56,120 | $69,454 |
| Median | $55,574 | $69,432 |
| Interquartile 25% (IQ1) | $47,845 | $60,485 |
| Interquartile 75% (IQ3) | $61,936 | $79,700 |
| Interquartile Range (IQR) | $14,091 | $19,215 |
| Standard Deviation (Sample) | $15,113 | $17,247 |
| Standard Deviation (Population) | $14,991 | $17,125 |
Similar Demographics by Householder Income Over 65 years
Demographics Similar to Scotch-Irish by Householder Income Over 65 years
In terms of householder income over 65 years, the demographic groups most similar to Scotch-Irish are Arapaho ($59,383, a difference of 0.11%), Dutch ($59,539, a difference of 0.15%), Finnish ($59,535, a difference of 0.15%), Immigrants from Sudan ($59,248, a difference of 0.34%), and Immigrants ($59,656, a difference of 0.35%).
| Demographics | Rating | Rank | Householder Income Over 65 years |
| Germans | 21.5 /100 | #196 | Fair $59,730 |
| Immigrants | Kenya | 21.1 /100 | #197 | Fair $59,710 |
| Moroccans | 20.7 /100 | #198 | Fair $59,683 |
| Immigrants | Immigrants | 20.2 /100 | #199 | Fair $59,656 |
| French | 20.2 /100 | #200 | Fair $59,656 |
| Dutch | 18.3 /100 | #201 | Poor $59,539 |
| Finns | 18.2 /100 | #202 | Poor $59,535 |
| Scotch-Irish | 16.9 /100 | #203 | Poor $59,447 |
| Arapaho | 16.0 /100 | #204 | Poor $59,383 |
| Immigrants | Sudan | 14.2 /100 | #205 | Poor $59,248 |
| Immigrants | South America | 13.0 /100 | #206 | Poor $59,151 |
| Salvadorans | 12.9 /100 | #207 | Poor $59,141 |
| Uruguayans | 12.3 /100 | #208 | Poor $59,090 |
| Slovaks | 11.7 /100 | #209 | Poor $59,039 |
| Nigerians | 11.2 /100 | #210 | Poor $58,992 |
Demographics Similar to Afghans by Householder Income Over 65 years
In terms of householder income over 65 years, the demographic groups most similar to Afghans are Immigrants from Northern Europe ($69,003, a difference of 0.070%), Asian ($68,822, a difference of 0.19%), Immigrants from Denmark ($68,801, a difference of 0.22%), Immigrants from Australia ($69,164, a difference of 0.31%), and Immigrants from China ($69,174, a difference of 0.32%).
| Demographics | Rating | Rank | Householder Income Over 65 years |
| Immigrants | Sweden | 100.0 /100 | #24 | Exceptional $69,722 |
| Immigrants | Belgium | 100.0 /100 | #25 | Exceptional $69,703 |
| Immigrants | Sri Lanka | 100.0 /100 | #26 | Exceptional $69,426 |
| Immigrants | Switzerland | 100.0 /100 | #27 | Exceptional $69,343 |
| Immigrants | China | 100.0 /100 | #28 | Exceptional $69,174 |
| Immigrants | Australia | 100.0 /100 | #29 | Exceptional $69,164 |
| Immigrants | Northern Europe | 100.0 /100 | #30 | Exceptional $69,003 |
| Afghans | 100.0 /100 | #31 | Exceptional $68,951 |
| Asians | 100.0 /100 | #32 | Exceptional $68,822 |
| Immigrants | Denmark | 100.0 /100 | #33 | Exceptional $68,801 |
| Immigrants | Ireland | 100.0 /100 | #34 | Exceptional $68,495 |
| Tongans | 100.0 /100 | #35 | Exceptional $68,235 |
| Immigrants | Austria | 99.9 /100 | #36 | Exceptional $68,208 |
| Turks | 99.9 /100 | #37 | Exceptional $68,037 |
| Estonians | 99.9 /100 | #38 | Exceptional $67,926 |